Get started with Unity on Android
Build and deploy to Android
Using the Profiler, when running your project inside the Unity Editor, can be a very convenient and quick way of assessing high level performance issues. However, your end-users’ device is likely to have different performance characteristics.
You should always check the performance of your app on a device comparable to that which your end users will use. In this next step, you will run the profiling again but this time on your Android device.
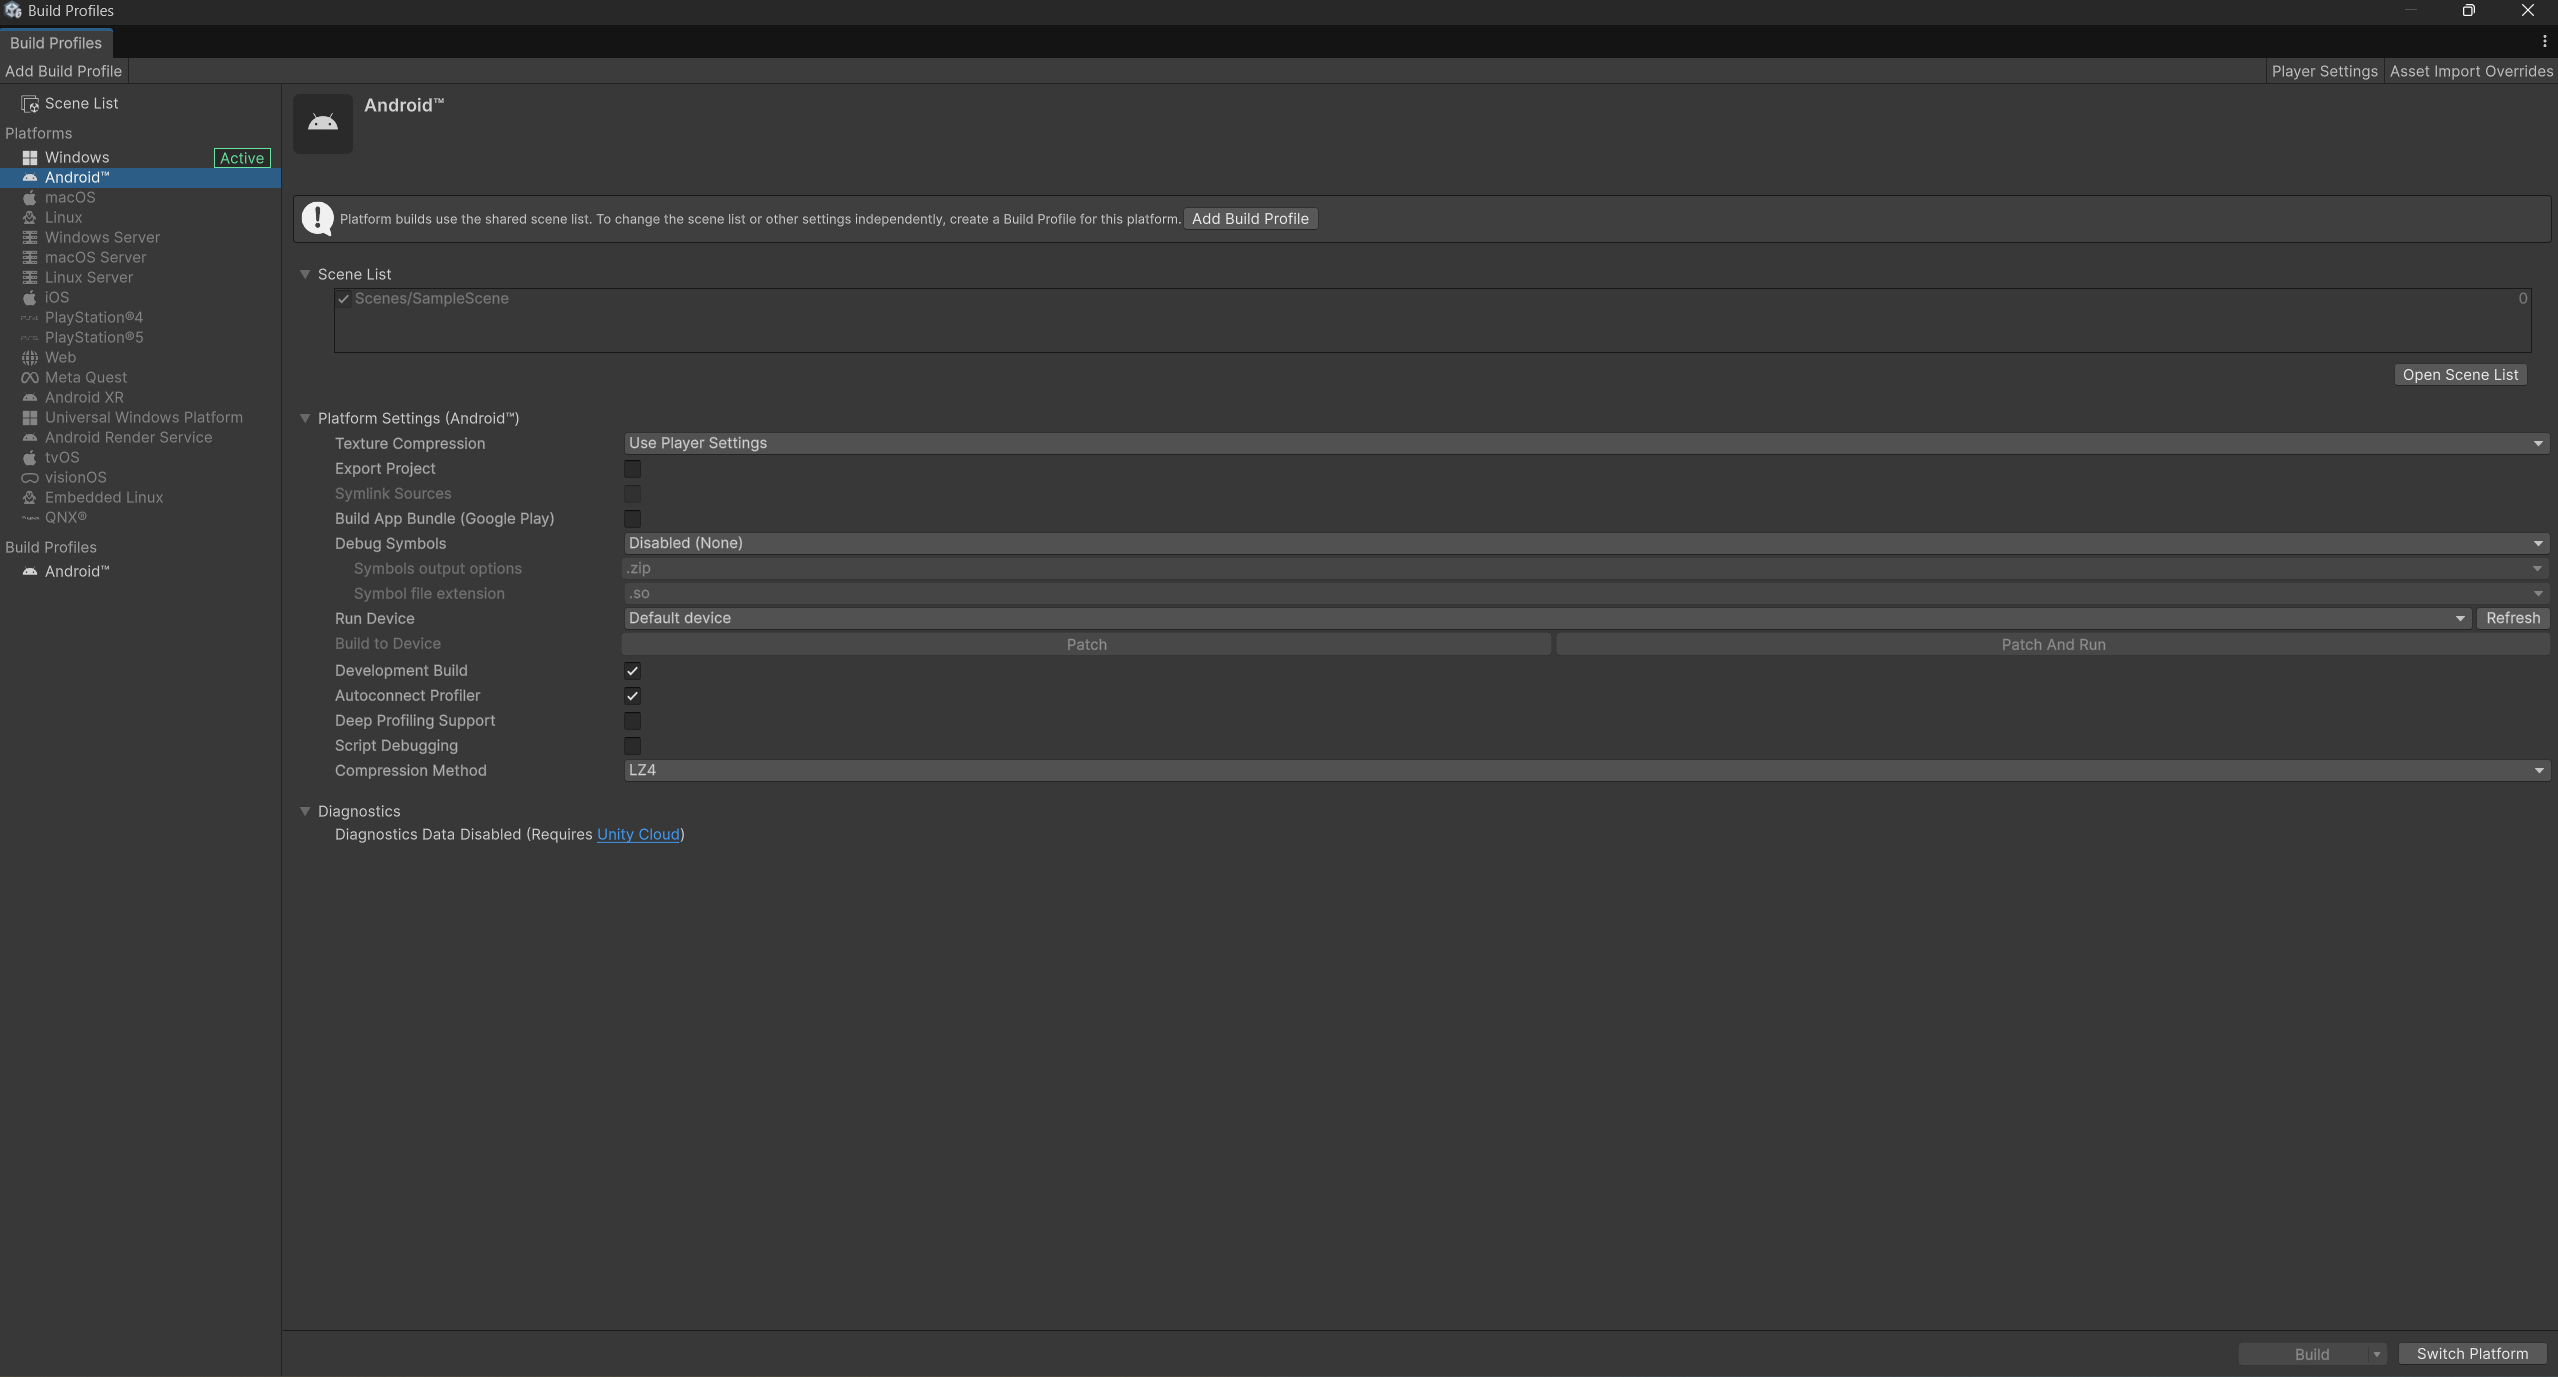
Select File->Build Settings. You will see the Build Settings window as before.
To activate profiling, you will enable the Development Build and Autoconnect Profiler options.
 Figure 1. Build Profiles window
You should already have the Android platform selected, so connect your device and click on Build and Run.
Choose a filename for your build.
As before in the editor, the Profiler will automatically start collecting data and your timeline will start to fill.
Allow the app to run for a few seconds. Once you have a few seconds of timeline, you can stop the app.
You have confirmed that the app’s performance is poor on Android as well as in the Unity editor.
Profiling on Android
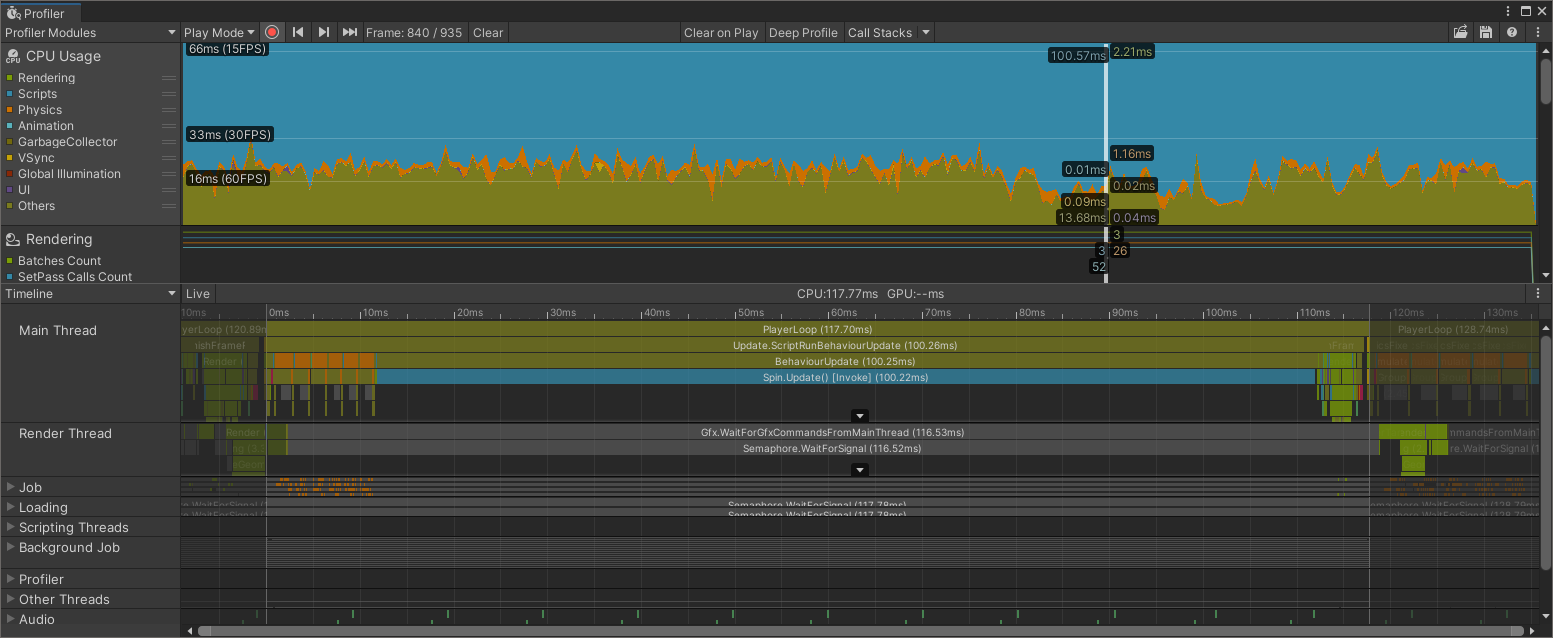
The Profiler window below shows a timeline of a capture made using a Samsung S8 mobile phone.
 Figure 2. Profiler window with Android results
Remembering that you’re trying to find out why the spinning cube isn’t running smoothly, there are a few things that stand out in the timeline:
In the main timeline at the top, the different areas of the app are colored. The graph is filled with a lot of blue. On the left under CPU Usage you can see that blue is for Scripts.
Unity has provided convenient figures for you to compare against in the main timeline (on the left, you see tags showing 60FPS, 30FPS and 15FPS). It is telling you that in order to hit 60 frames per second (FPS), your frame needs to take no more than 16 milliseconds (ms). To hit 30 frames per second, your frame needs to take less than 33ms, and less than 66ms if you targeted a frame rate of 15FPS.
Looking at the Main Thread for the selected frame, you can see that the PlayerLoop is taking 117.7ms. That is awfully high and way above the targeted frame time of 16ms. Part of the high level PlayerLoop task is
Update.ScriptRunBehaviourUpdatewhich calls the Update function on all of the scripts in the app. The last entry is Spin.Update.Spin.Update is the Update function in the Spin component. On the frame selected it took over 100ms. Even with just this function alone, the maximum frame rate would be something like 10FPS (one second or 1000ms, divided by 100ms, is 10).
So by using the Profiler window, you now know where to look in the next step of your investigation.
Try fixing the performance issue yourself.
Hint: To solve the problem, try looking for a very unnecessary function call in Spin.Update(). Remove the call and then re-deploy to your Android device. The cube will now be spinning smoothly.
For more on using the Profiler to find performance issues, see Profiling Unity Apps on Android .