Get started with Unity on Android
Build for Android
Open the sample project (if you haven’t already) and open the SampleScene as per the previous section.
You’re going to build the sample for Android. To do so takes just a few steps and they are all achieved from the Build Settings window.
First off, you need to switch the project to Android.
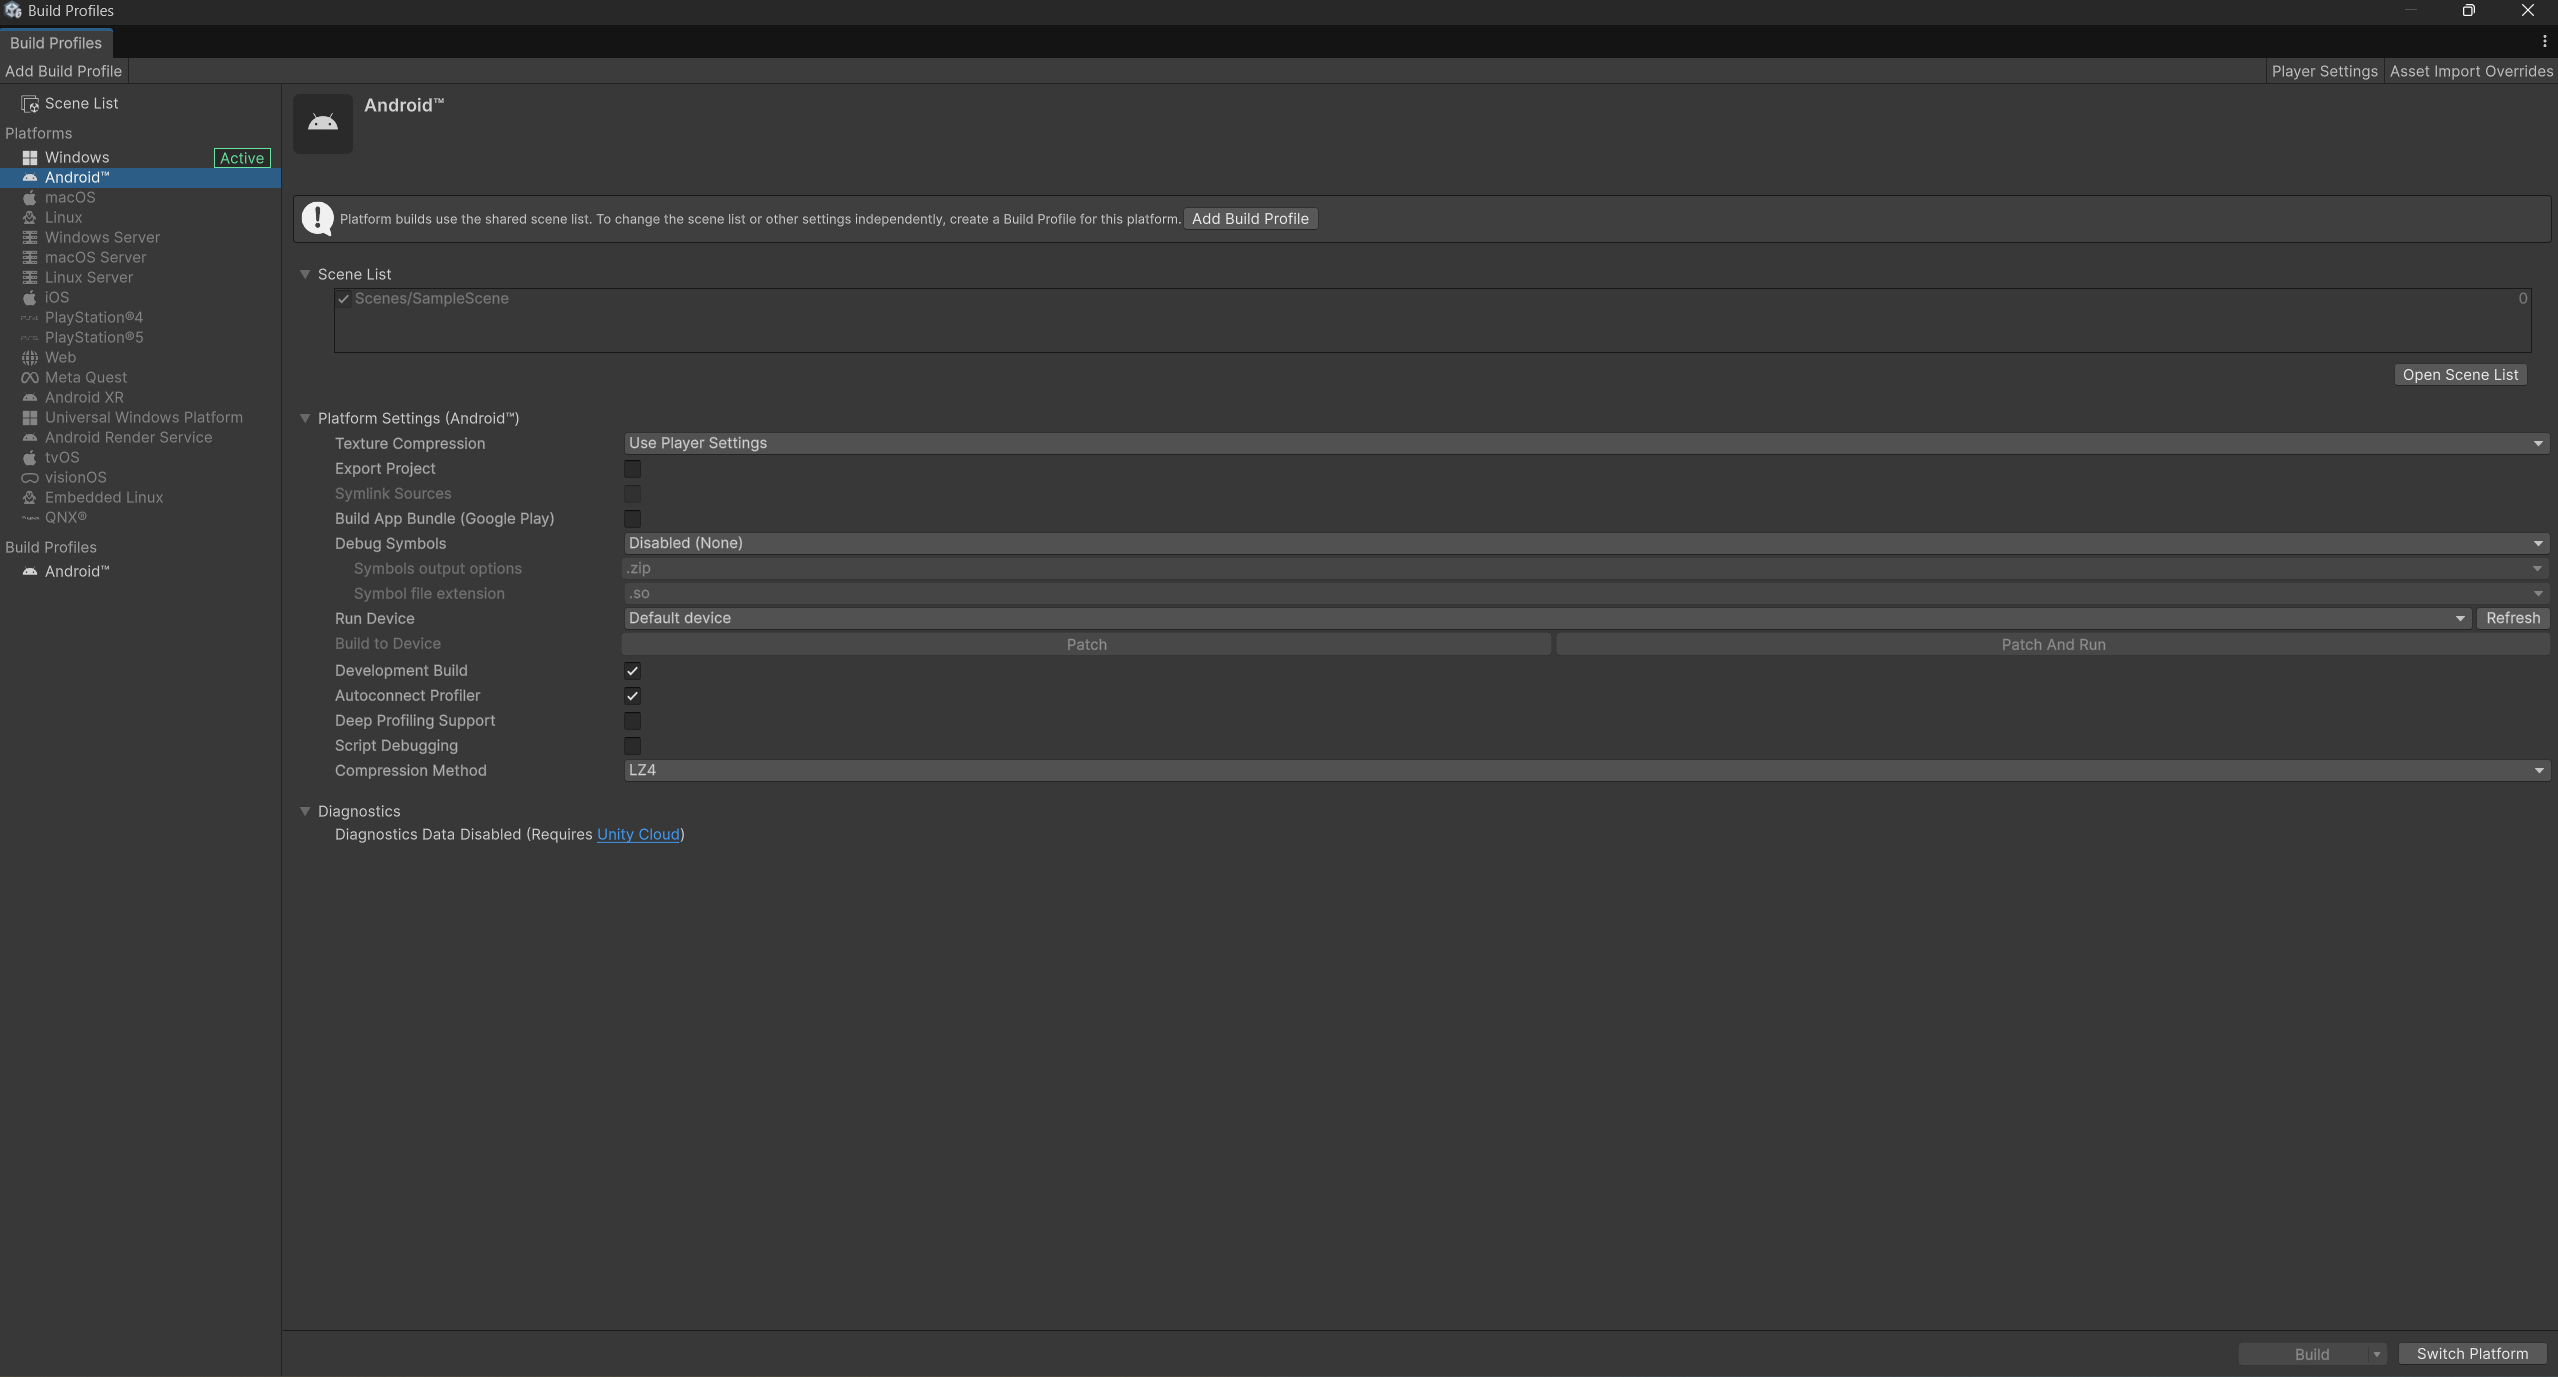
Select File->Build Profile to show the Build Profile window:
 Figure 1. Build Profiles window
In your project the platform labeled Active will be your machine’s operating systems (Windows, Mac or Linux). Since you are developing an Android app you must rebuild for Android.
Select Android on the left and then click on Switch Platform at the bottom of the build profiles screen. This will take a few moments as it re-builds the assets for the Android mode (this step can take longer the first time it is done for any project).
 Figure 2. Scene list
In the screenshot, you can see that the SampleScene is already included in the build and preselected as the first scene to load. This list shows all the scenes that will be packaged into the final build. The top scene in the list is the one Unity will load first when the game starts. If your project contains multiple scenes, this is where you would select which ones to include and set your startup scene.
Prepare your Android device for development
To deploy to your Android device, you will need to enable the Android Developer Options and USB Debugging on your device:
Go to your Android settings app
Scroll to the bottom to find Developer Options. If you do not see this option, follow the instructions for configuring developer options .
In Developer Options ensure the On option is enabled.
Scroll down to find and enable USB Debugging.
Deploy to your Android device
Connect your Android device to your computer using a USB cable. Unity may take a few moments to recognize it.
Android may ask for confirmation before enabling the connection.
In the Build Profile window:
Ensure your device appears in the Run Device menu and select it, if the device doesn’t appear make sure to press the “Refresh” button then your device should appear in the drop down menu.
Select Build and Run. Choose a location to save your build.
The project will now build for Android and deploy to your device.
You will see the spinning cube running slowly. On recent Android devices, you would definitely expect it to run more quickly (at 60 frames per second).
You’re now ready to dive into the Unity Profiler.