Get started with Arm Performance Studio
Introduction
What is Arm Performance Studio?
Setup tasks
Arm Streamline example capture
Streamline with your application
Performance Advisor example report
Performance Advisor with your application
Frame Advisor
RenderDoc for Arm GPUs
Mali Offline Compiler
Supporting tools
Next Steps
Get started with Arm Performance Studio
Now that you have seen an Arm Streamline example capture , you can use it to capture data from your own application.
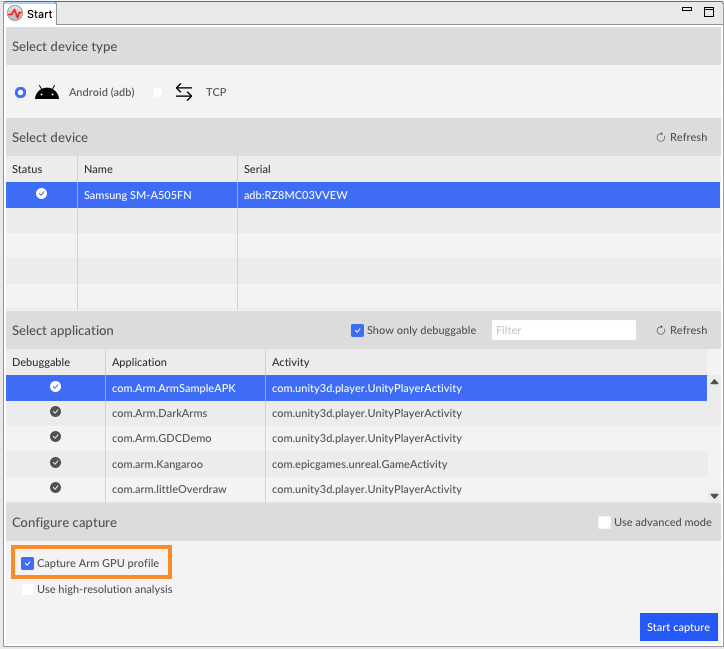
Select the device and application in Streamline
Launch the Performance Studio Hub and open Streamline.
- On Windows, search for Performance Studio.
- On macOS and Linux, open the Performance Studio application file from the install directory.

In the Streamline
Startview, selectAndroid (adb)as your device type, then select your device from the list of detected devices. This installs thegatorddaemon and connects to the device.Wait for the list of available packages to populate, then select the one you wish to profile.
With
Capture Arm GPU profileselected, Streamline will detect the Arm GPU in the device, and select an appropriate counter template for it. Alternatively, to choose a different template or to build your own configuration, selectUse advanced modeand clickConfigure counters. Connect to the device
Optionally, you can set a preferred location to store your captures using Window > Preferences > Data Locations. New reports will be created in the topmost folder specified.
Capture data
Click
Start captureto start capturing profile data from the device. Enter a name and location for the capture file.The application starts automatically on the device. Interact with the application as desired for the profiling run you wish to do.
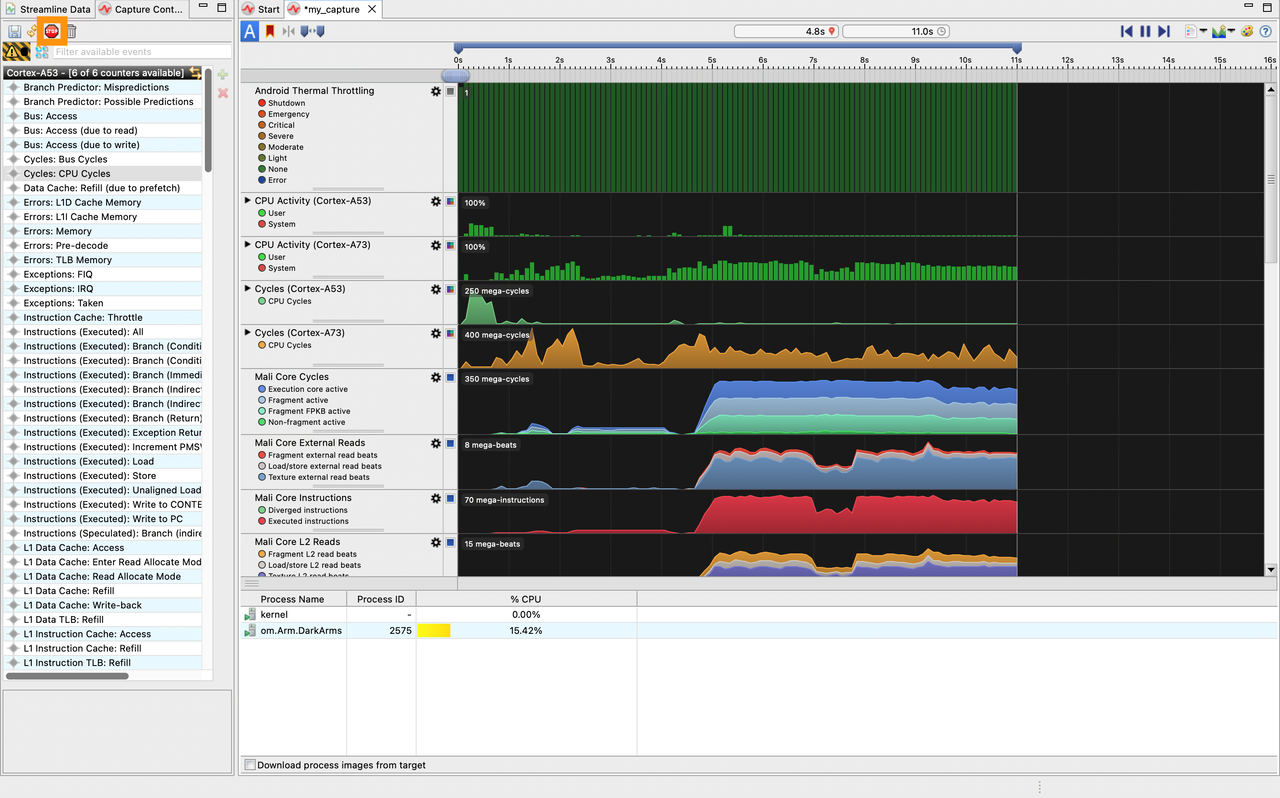
When you have collected enough data, click
Stop capture. Stop Capture
Streamline will stop capturing data, remove the daemon, and process the captured data.
Analyze the results
The charts in the Timeline view show the performance counter activity captured from the device. Hover over the charts to see the values at that point in time. Use the Calipers to focus on particular windows of activity. Refer to the
Streamline User Guide
for full instructions on how to use the features in the Timeline view.
Understanding the output of Streamline is key to the usefulness of Streamline. The documentation for Android performance triage with Streamline on Arm Developer describes how to understand the capture from a number of points of view, depending on what information you are trying to extract from it.