Get started with Arm Performance Studio for mobile
Introduction
What is Arm Performance Studio?
Setup tasks
Arm Streamline example capture
Streamline with your application
Performance Advisor example report
Performance Advisor with your application
Frame Advisor
Graphics Analyzer
Mali Offline Compiler
Supporting tools
Review
Next Steps
Get started with Arm Performance Studio for mobile
Graphics Analyzer is a tool to help OpenGL ES and Vulkan developers get the best out of their applications through analysis at the API level.
The tool allows you to observe API call arguments and return values, and interact with a running target application to investigate the effect of individual API calls. It highlights attempted misuse of the API, and gives recommendations for improvements.
Prerequisites
Build your application, and setup your Android device as described in Setup tasks .
Capture data from the device
In Graphics Analyzer, select
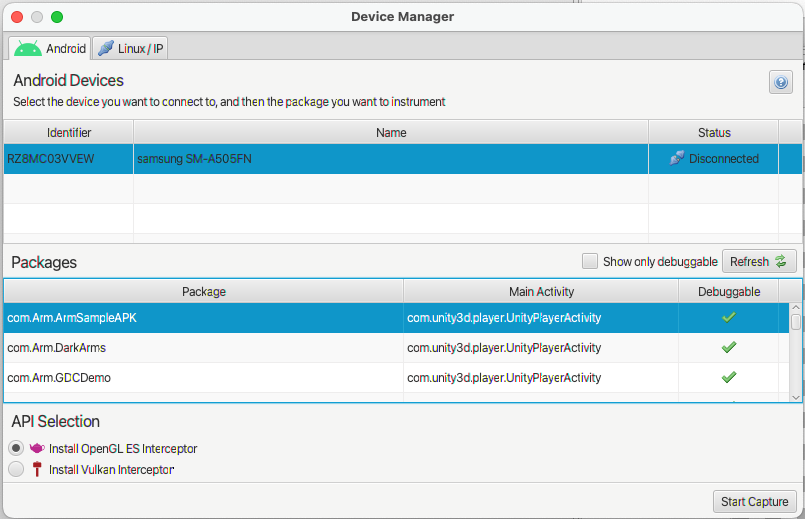
Debug>Device Manager, then select your device from the list of detected devices.Select the required APIs (OpenGL ES and/or Vulkan) for your application.
 Device Manager
Click
Start captureto connect to the device and install Graphics Analyzer daemon on the device.Start the application on the device, and interact as desired. Graphics Analyzer will collect API calls from the device.
To collect
Frame Bufferdata, pause the application when you reach the frame of interest.Click the
cameraicon to capture the frame buffer output.You can also enable
Overdraw,Shader, and/orFragment countdata to be captured. Click thecameraicon to capture this data.
When you have captured enough data, click
Stop tracing. Graphics Analyzer will stop collecting data, remove the daemon(s), and process the captured data.
Analyze the capture
The captured data will be processed into a report that the user can manually examine. The frames are listed in the Trace Outline view. A full description of the capabilities is given in the
Graphics Analyzer User Guide
.
Understanding the output of the report is key to the usefulness of Graphics Analyzer. This video tutorial shows how to make use of the features of Graphics Analyzer.