Perform Sentiment Analysis on X on Arm-based EKS clusters
Introduction
Overview
Monitoring sentiment with Elasticsearch and Kibana
Set up Sentiment Analysis with Amazon EKS
Monitor the cluster with Prometheus and Grafana
Next Steps
Perform Sentiment Analysis on X on Arm-based EKS clusters
Elasticsearch
Elasticsearch is a NoSQL database, search, and analytics engine. It is designed to store, search, and analyze large amounts of data. It has a real-time indexing capability which is crucial for handling high-velocity data streams such as X posts.
Kibana
Kibana is a customizable dashboard and visualization tool which integrates seamlessly with Elasticsearch. It provides valuable insights and opportunities to explore collected data by presenting it in multiple differing views.
In this Learning Path, you will use a Kibana dashboard as an interface to interact with X data, apply filters, and receive alerts.
How do I install Elasticsearch and Kibana?
There are multiple ways to install Elasticsearch and Kibana. One of these methods is described here.
Before you begin, ensure that Docker and Docker Compose have been installed on your computer.
Use a text editor to create a docker-compose.yml file, and copy-and-paste in the contents below:
version: '2.18.1'
services:
  elasticsearch:
    image: elasticsearch:8.15.2
    container_name: elasticsearch
    environment:
      - discovery.type=single-node
      - ES_JAVA_OPTS=-Xms512m -Xmx512m
      - xpack.security.enabled=false
      - HTTP_ENABLE=true
    ports:
      - "9200:9200"
    networks:
      - elk

  kibana:
    image: kibana:8.15.2
    container_name: kibana
    ports:
      - "5601:5601"
    environment:
      - ELASTICSEARCH_HOSTS=http://elasticsearch:9200
      - HTTP_ENABLE=true
    depends_on:
      - elasticsearch
    networks:
      - elk

networks:
  elk:
    driver: bridge
Use the following command to deploy Elasticsearch and the Kibana Dashboard:
docker compose up
If you do not have the docker compose plugin already installed, you can install it through the following commands:
sudo apt-get update sudo apt-get install docker-compose-plugin
After the dashboard is set up, use the public IP of your server on port 5601 to access the Kibana dashboard. See Figure 2.
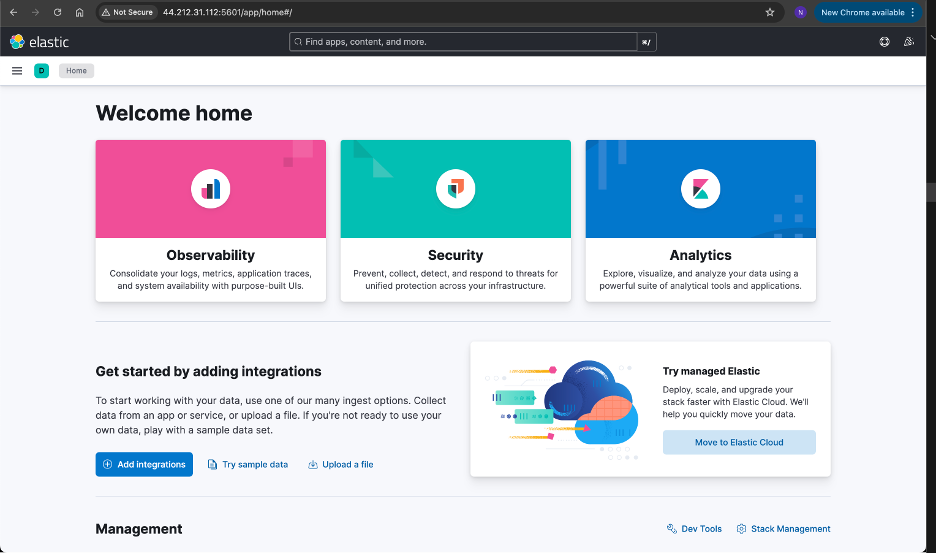 Figure 2: Kibana Dashboard Setup.
Switch to Stack Management using the menu on the left side as Figure 3 shows.
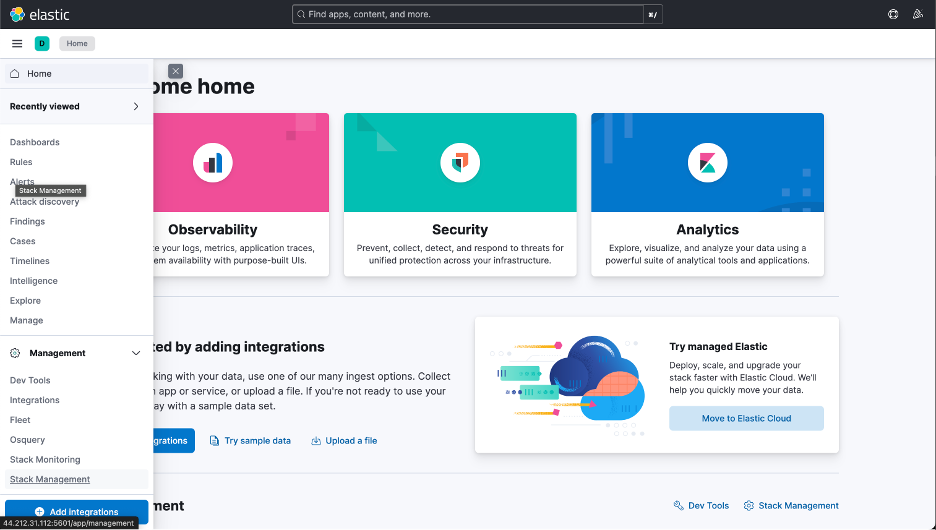 Figure 3: Switch to Stack Management.
To make sure that you are receiving the data from the sentiment analysis application through Elasticsearch, check whether you have the Data View enabled in Stack Management.
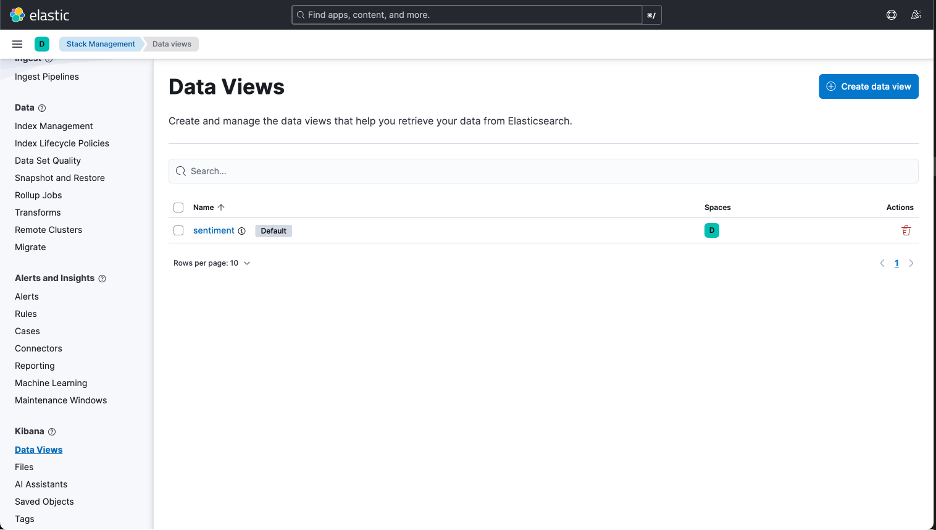 Figure 4: Create and Manage Data Views.
You can also check the types of attributes that are received as the Data Views. Now, you can switch to the dashboards on the left menu and start creating the visualizations to analyze the data.
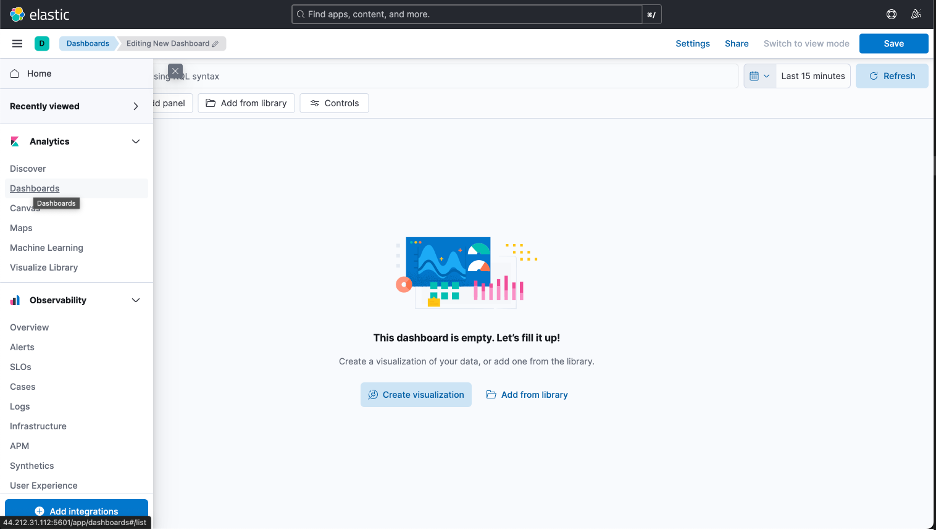 Figure 5: Dashboards on Left Menu.
Figure 6 shows a sample dashboard structure, displaying the records of different sentiments.
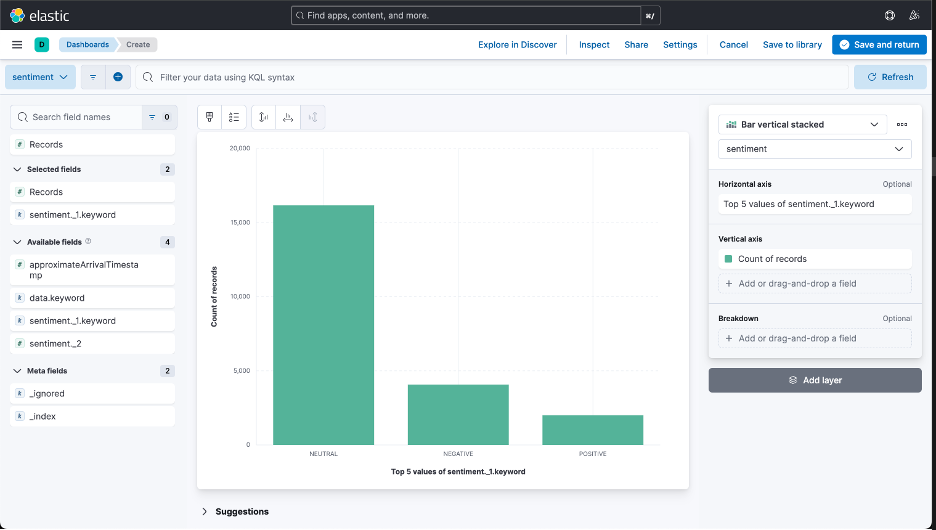 Figure 6: Sample Dashboard Structure.
Similarly, you can design and create dashboards to analyze a particular set of data. The screenshot in Figure 7 shows the dashboard designed for this Learning Path.
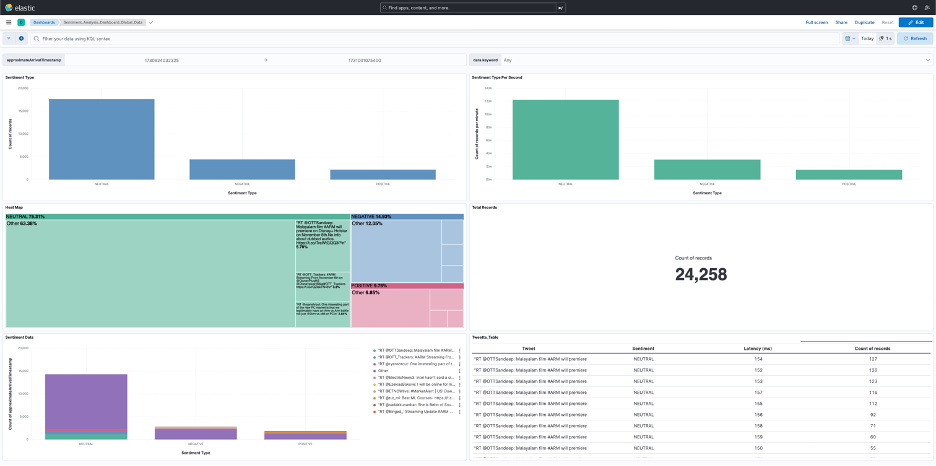 Figure 7: Dashboard for this Learning Path.
Navigate to the dashboards directory in the cloned GitHub repository and locate the sentiment_dashboard.ndjson file.
Import this file into the Kibana dashboard and you should see a dashboard as shown in the previous step.