Perform Sentiment Analysis on X on Arm-based EKS clusters
Introduction
Overview
Monitoring sentiment with Elasticsearch and Kibana
Set up Sentiment Analysis with Amazon EKS
Monitor the cluster with Prometheus and Grafana
Next Steps
Perform Sentiment Analysis on X on Arm-based EKS clusters
Monitor CPU and RAM usage with Prometheus and Grafana
Prometheus is a monitoring and alerting tool. You can use it for collecting and querying real-time metrics in cloud-native environments like Kubernetes. Prometheus collects essential metrics about CPU usage, memory usage, pod counts, and request latency. This helps you to monitor the health and performance of your Kubernetes clusters.
Grafana is a visualization and analytics tool. It integrates with data sources from Prometheus to create interactive dashboards to monitor and analyze Kubernetes metrics.
The terrafom script executed in the previous step automatically installs Prometheus and Grafana in the EKS cluster. However, if you wish to have more flexibility with the installable versions for both, follow the instructions below.
Install Prometheus on your EKS cluster
You can use Helm to install Prometheus on the Kubernetes cluster.
Follow the Helm documentation to install it on your computer.
Confirm Helm is installed by running the version command:
helm version
The output is similar to:
version.BuildInfo{Version:"v3.16.3", GitCommit:"cfd07493f46efc9debd9cc1b02a0961186df7fdf", GitTreeState:"clean", GoVersion:"go1.22.7"}
Create a namespace in your EKS cluster to host prometheus pods:
kubectl create namespace prometheus
Add the following Helm repo for prometheus:
helm repo add prometheus-community https://prometheus-community.github.io/helm-charts
Install Prometheus on the cluster with the following command:
helm install prometheus prometheus-community/prometheus \
  --namespace prometheus \
  --set alertmanager.persistentVolume.storageClass="gp2" \
  --set server.persistentVolume.storageClass="gp2"
Check that all pods are up and running:
kubectl get pods -n prometheus
Install Grafana on your EKS cluster
Add the following Helm repo for Grafana:
helm repo add grafana https://grafana.github.io/helm-charts
Use a text editor to create a grafana.yaml file with the following contents:
datasources:
  datasources.yaml:
    apiVersion: 1
    datasources:
    - name: Prometheus
      type: prometheus
      url: http://prometheus-server.prometheus.svc.cluster.local
      access: proxy
      isDefault: true
Create another namespace for Grafana pods:
kubectl create namespace grafana
Install Grafana on the cluster with the following command:
helm install grafana grafana/grafana \
  --namespace grafana \
  --set persistence.storageClassName="gp2" \
  --set persistence.enabled=true \
  --set adminPassword=‘kubegrafana’ \
  --values grafana.yaml \
  --set service.type=LoadBalancer
Check all pods are up and running:
kubectl get pods -n grafana
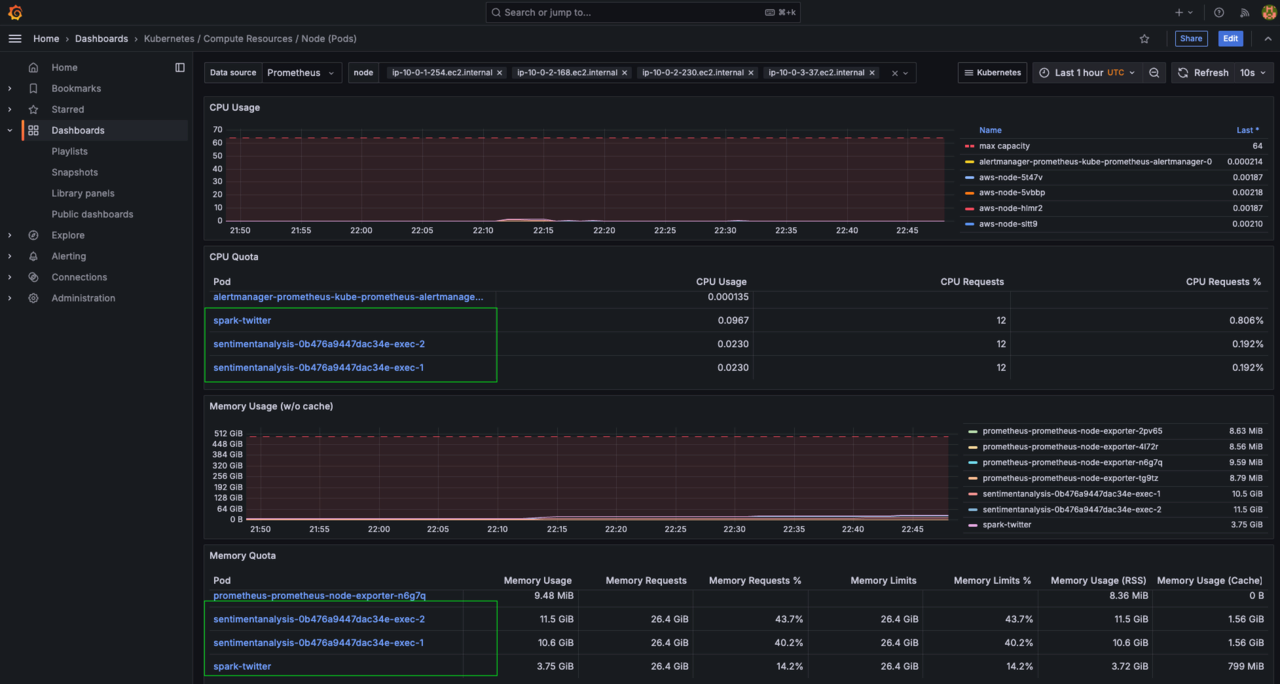
Log in to the Grafana dashboard using the LoadBalancer IP and click on Dashboards in the left navigation page.
Locate a Kubernetes/Compute Resources/Node (Pods) dashboard and click on it.
You should see a dashboard like below for your Kubernetes cluster:
 Figure 8: Dashboard for Kubernetes Cluster.