Debug Neoverse N2 Reference Design with Arm Development Studio
Introduction
Set up your development environment
Debugging SCP/LCP/RSE
Debugging BL1
Debugging BL31
Debugging BL33 / UEFI
Next Steps
Debug Neoverse N2 Reference Design with Arm Development Studio
Debugging BL1
Due to RSE CPU wait hold and the APs will be powered off. You will not be able to start the debugger until RSE has powered the AP cores.
A workaround is to modify BL1 to spin on entry.
Navigate to <workspace>/rd-infra/tf-a/bl1/aarch64/bl1_entrypoint.S, find the bl1_entrypoint function, and add a b . instruction:
func bl1_entrypoint

    b   .   // <-- Branch-to-self added here

    /* ---------------------------------------------------------------------
    * If the reset address is programmable then bl1_entrypoint() is
    * executed only on the cold boot path. Therefore, we can skip the warm
    * boot mailbox mechanism.
    * ---------------------------------------------------------------------
    */
    el3_entrypoint_common                               \
        _init_sctlr=1                                   \
        _warm_boot_mailbox=!PROGRAMMABLE_RESET_ADDRESS  \
        _secondary_cold_boot=!COLD_BOOT_SINGLE_CPU      \
        _init_memory=1                                  \
        _init_c_runtime=1                               \
        _exception_vectors=bl1_exceptions
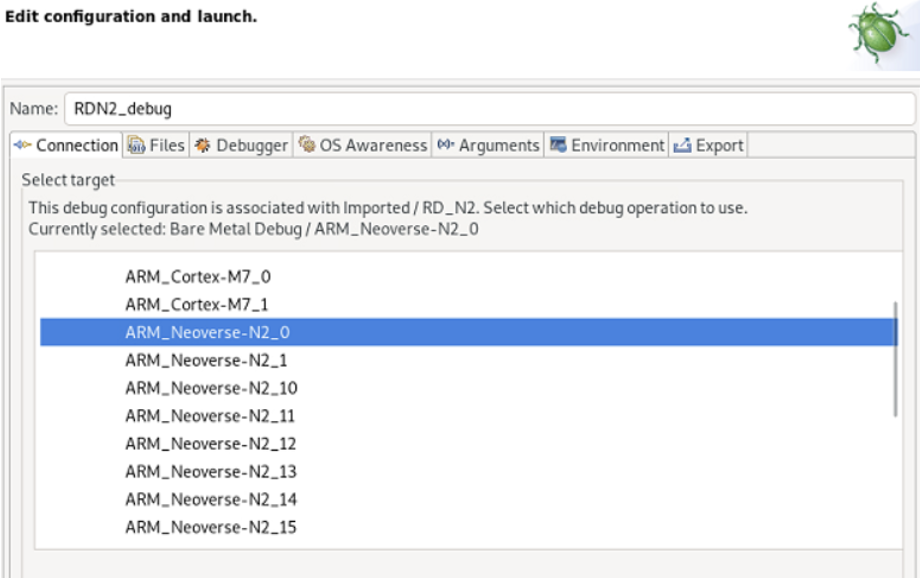
In the Edit configuration and launch panel Connection tab, select the ARM_Neoverse-N2_0.
 Figure 1. Select target
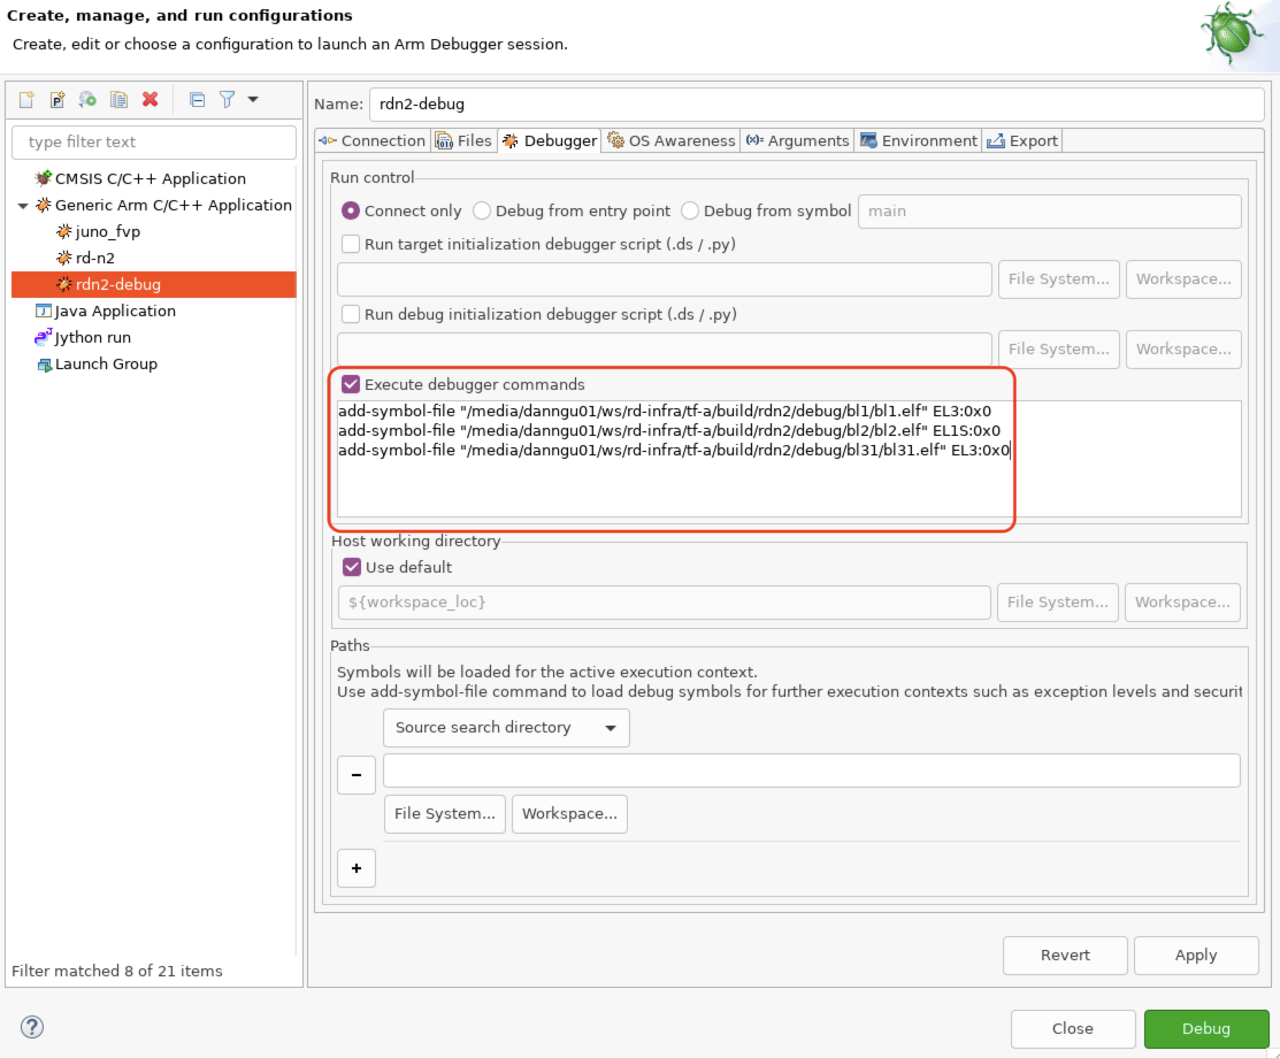
Add debug symbols. In the Debugger tab, check the Execute debugger commands, and add the following commands:
add-symbol-file "/<workspace>/rd-infra/tf-a/build/rdn2/debug/bl1/bl1.elf" EL3:0x0
add-symbol-file "/<workspace>/rd-infra/tf-a/build/rdn2/debug/bl2/bl2.elf" EL1S:0x0
add-symbol-file "/<workspace>/rd-infra/tf-a/build/rdn2/debug/bl31/bl31.elf" EL3:0x0
If you would like to add platform-specific debug files, the memory locations are in the corresponding platform_h.def file.
 Figure 2. Load TF-A symbols
These commands load the symbol files and specify the memory address location, updating workspace to include the path to your own workspace directory.
The EL (Exception Level) and number at the end of each command, for example, EL3:0, ensure the symbols are loaded into the correct virtual address space and at the correct memory offset. ATF uses absolute addresses for its symbols so you can use an offset of 0.
When you connect the debugger, the primary CPU will be “spinning” on a b . instruction from the one you manually added to the bl1_entrypoint function.
In this debug panel, you can find common debugging functions like stepping and skipping.
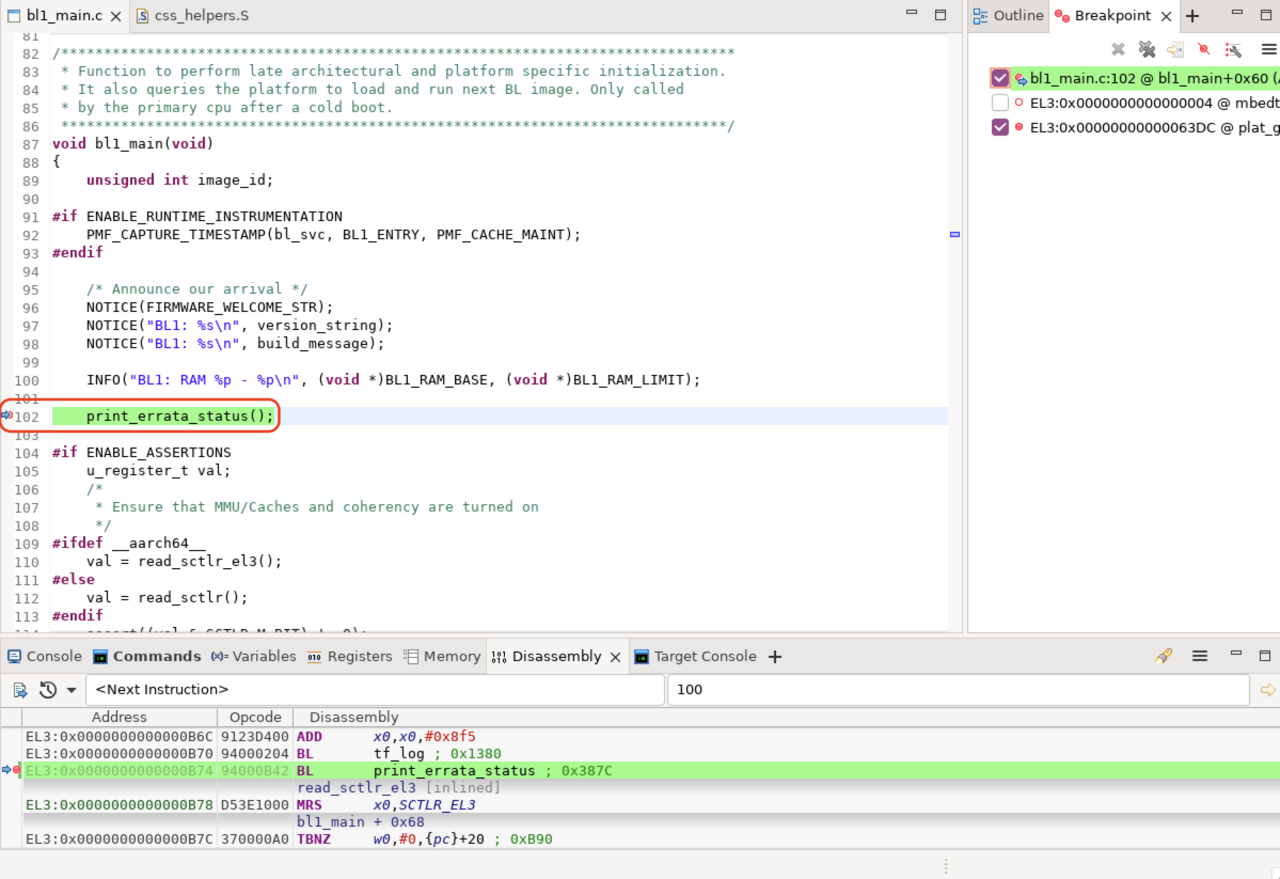
Set a breakpoint in the function you would like to debug. In this example, you can set a breakpoint at bl1_main().
Simply interrupt the CPU and enter debug command `set $pc += 4’; you can now step through and debug the TF-A boot flow.
 Figure 5. BL1 breakpoint
Alternate break method
Another method of setting a breakpoint without modifying TF-A is by launching the model with --break.
The general syntax for defining a breakpoint is:
--break <INST>=<MEMSPACE>@<ADDRESS>
<INST>: Processor identifier (e.g., AP0 in cluster 0).<MEMSPACE>: Memory space identifier (e.g., id=1 for EL2 VA space).
To determine valid instance and memory space names, run: --list-instances or --list-memory.
Example command:
./boot.sh -p rdv3r1cfg1 -a "--break RD_V3_R1_Cfg1.socket0.css0.lcp_app_group00.app0.cluster.cpu0=0@0x0"