Implement Code level Performance Analysis using the PMUv3 plugin
Introduction
PMUv3 plugin features
Download and build the PMUv3 plugin
Instrument one section of code
Plot, visualize, and analyze the results
Instrument multiple sections of code
Next Steps
Implement Code level Performance Analysis using the PMUv3 plugin
Why should you use the PMUv3 plugin?
Many tools allow you to profile a complete application but sometimes you need to analyze specific code sections in order to investigate performance. When you need precise measurement of individual functions or sections of code implementing a specific task you can use the PMUv3 plugin.
The PMUv3 plugin uses C/C++ code instrumentation and the hardware events available in the Arm PMUv3 architecture to provide this functionality.
To access the performance counter registers directly, the instrumentation code uses the mmap() system call on the Linux Perf event file descriptor. This action prompts the Linux kernel to enable user space access and returns a handle to read the raw performance counter registers.
The PMUv3 plugin requires you to run applications with sudo or as root to access the performance counters.
The PMUv3 plugin provides an easy way to measure CPU Cycle counts as well as more complex scenarios to measure different bundles of events in one run, such as multiple cache metrics along with CPU cycles. It not only records the values of raw counter registers but also provides support to visualize the results in a .CSV format using a post-processing program.
The source code for the PMUv3 plugin is written in C and you can call the APIs from a C codebase by including the header file. For a C++ codebase, you can include the headers using the extern keyword.
Features of the PMUv3 plugin
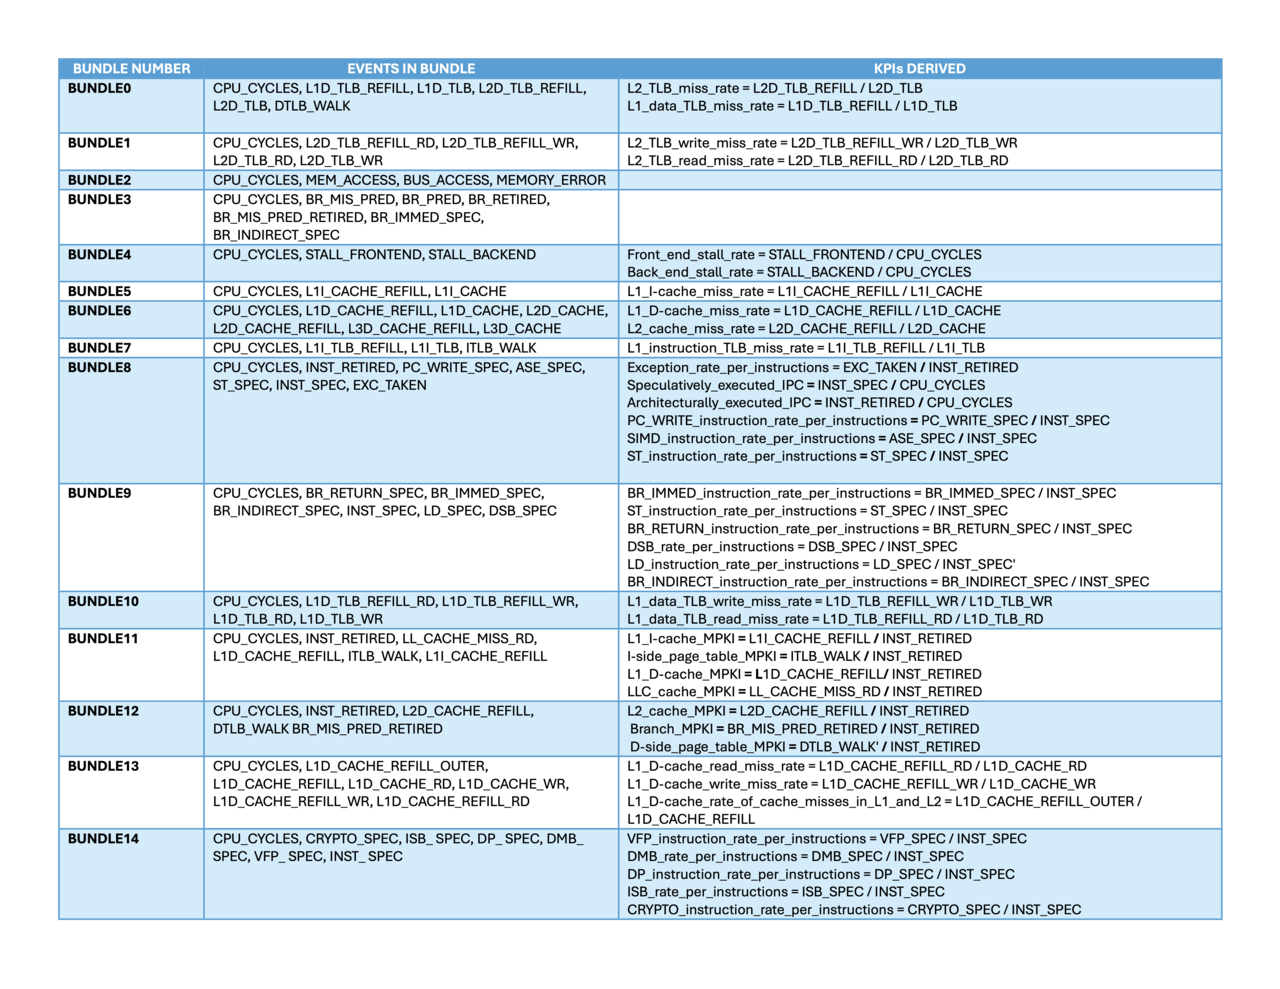
The PMUv3 plugin groups performance events together into categories called bundles. There are 15 categories (bundles) and each bundle has a set of PMU events.
The events in each bundle and the derived performance metrics are shown in the table below:
 Table 1. Bundled Events
Next, learn how to get the PMUv3 plugin and use it in an application.