Optimize memory access behavior using Arm Performix and the Arm MCP Server
Introduction
Understand CPU memory hierarchy and address translation
Set up and build the example application
Profile memory access behavior with Arm Performix
Optimize the application manually and with the Arm MCP Server
Next Steps
Optimize memory access behavior using Arm Performix and the Arm MCP Server
Manually optimize the application
The src/users_solution/ directory is an editable copy of src/baseline. Using the data collected from Performix, refactor the Particle data structure and associated function signatures and call sites to improve the L1 cache hit rate. The baseline result showed that update_positions() dominated the samples, had a low L1 cache hit rate, and did not show significant TLB walks.
Consider how the Particle data structure maps to a 64-byte cache line. Also consider which member variables in the Particle struct are used in the hot loop.
After you make changes in src/users_solution/, rebuild the binary with the following commands:
cd ~/Orbiting-Galaxy-Example/build
cmake --build . --parallel
Use the Performix GUI to assess performance changes for the ~/Orbiting-Galaxy-Example/build/users_solution binary. A reference solution is available in src/optimized.
To measure wall time and compare it against the baseline, run:
/usr/bin/time -v ~/Orbiting-Galaxy-Example/build/users_solution
The hot loop is instrumented with scopedTimer, so you’ll also see the loop duration printed directly to the terminal. Compare it with the baseline result of 571 milliseconds shown at the end of the section.
Optimize with an AI agent and the Arm MCP Server
You can use the Arm Model Context Protocol (MCP) Server with a code assistant such as Kiro, Gemini, Codex, or GitHub Copilot to optimize the application. The MCP server includes direct tool support to invoke Performix on a remote target. It integrates with MCP-compatible coding assistants and can provide performance insights to create a useful feedback loop. The following example shows how to connect to OpenAI Codex. For other tools, see your preferred coding assistant .
You need an OpenAI account to use the Codex CLI.
Install Docker and pull the MCP server image.
docker pull armlimited/arm-mcp:latest
To ensure the MCP server can invoke performix on remote machines, pass optional Docker arguments for your SSH private key and known hosts file. For example, use this TOML format for the Codex CLI by adding the following to ~/.codex/config.toml:
[mcp_servers.arm-mcp]
command = "docker"
args = [
  "run",
  "--rm",
  "-i",
  "-v", "/path/to/your/workspace:/workspace",
  "-v", "/path/to/your/ssh/private_key:/run/keys/ssh-key.pem:ro",
  "-v", "/path/to/your/ssh/known_hosts:/run/keys/known_hosts:ro",
  "armlimited/arm-mcp"
]
Restart Codex and ask your coding assistant to run the memory access recipe, interpret the results, and inspect the relevant source code. Your prompt can include the remote target, workload binary, and source directory:
 Prompting Codex to analyze the baseline workload with Arm MCP
Alternatively, you can use the curated arm-full-optimization.md prompt file.
Review the optimized solution
A reference solution is available in the src/optimized directory of the repository. The baseline stores a vector of Particle* values, where each Particle is allocated separately and contains all particle fields in one 64-byte structure. The hot loop needs only x, y, z, vx, vy, and vz, but the baseline layout still steps through whole particle objects and performs unnecessary pointer chasing.
The optimized version changes the layout to a Structure of Arrays (SoA). Each field is stored in its own contiguous std::vector<float>:
struct ParticlesSoA {
    std::vector<float> x, y, z;
    std::vector<float> vx, vy, vz;
    std::vector<float> mass, charge, temperature;
    std::vector<float> pressure, energy, density;
    std::vector<float> spin_x, spin_y, spin_z;
};
The update_positions() function then walks the hot position and velocity arrays directly:
void update_positions(ParticlesSoA& p, int n, float dt) {
    for (int i = 0; i < n; ++i) {
        p.x[i] += p.vx[i] * dt;
        p.y[i] += p.vy[i] * dt;
        p.z[i] += p.vz[i] * dt;
    }
}
This removes Particle* indirection and improves cache-line utilization because the hot loop streams through only the data it uses.
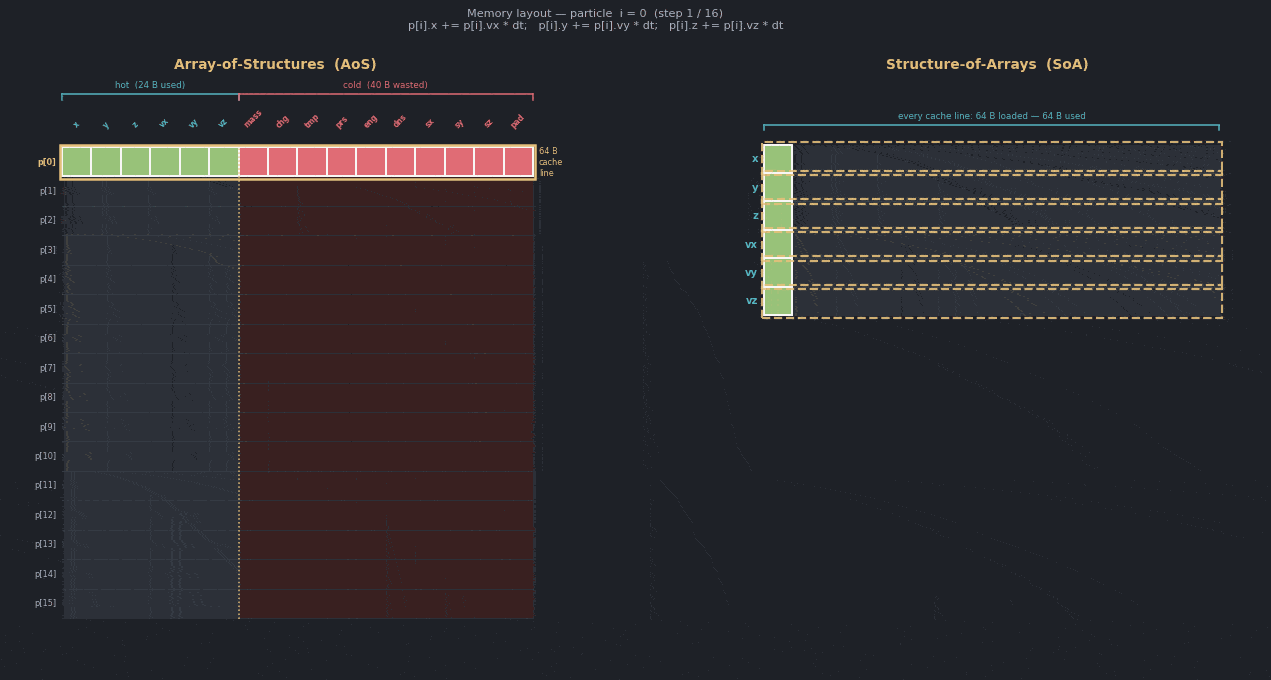
The following diagram compares the baseline and optimized layouts. Even though each particle is padded to a 64-byte cache line, many struct members are not read or written in the hot loop, so they remain cold. With a structure-of-arrays layout, all particles are still owned together, but cache lines contain more of the data that the loop actually touches.
Confirm with Performix
To see what fully optimized results look like, run the Performix Memory Access recipe against the pre-built reference binary. In the Performix GUI, rerun the recipe and change the binary path from ~/Orbiting-Galaxy-Example/build/baseline to ~/Orbiting-Galaxy-Example/build/optimized.
 Memory access results after the Structure of Arrays optimization
The optimized result shows much stronger L1 cache behavior. The hot update path now has 100% L1C loads in the captured result and a lower average L1C latency than the baseline. This confirms that the data layout change improved locality, not just wall-clock time.
Measure wall time and memory usage
Run the binaries directly on the remote machine without Performix to compare both wall time and memory usage:
/usr/bin/time -v ~/Orbiting-Galaxy-Example/build/baseline
/usr/bin/time -v ~/Orbiting-Galaxy-Example/build/optimized
The hot loop is also instrumented with scopedTimer, so you can directly observe the speedup from the change.
        Baseline took 571 milliseconds
        Command being timed: "./build/baseline"
        User time (seconds): 0.66
        System time (seconds): 0.02
        Percent of CPU this job got: 99%
        Elapsed (wall clock) time (h:mm:ss or m:ss): 0:00.69
        Average shared text size (kbytes): 0
        Average unshared data size (kbytes): 0
        Average stack size (kbytes): 0
        Average total size (kbytes): 0
        Maximum resident set size (kbytes): 92720
        Average resident set size (kbytes): 0
        Major (requiring I/O) page faults: 0
        Minor (reclaiming a frame) page faults: 22655
...
Optimized took 279 milliseconds
        Command being timed: "./build/optimized"
        User time (seconds): 0.35
        System time (seconds): 0.02
        Percent of CPU this job got: 100%
        Elapsed (wall clock) time (h:mm:ss or m:ss): 0:00.37
        Average shared text size (kbytes): 0
        Average unshared data size (kbytes): 0
        Average stack size (kbytes): 0
        Average total size (kbytes): 0
        Maximum resident set size (kbytes): 64044
        Average resident set size (kbytes): 0
        Major (requiring I/O) page faults: 0
        Minor (reclaiming a frame) page faults: 15500
| Metric | Baseline | Optimized | Explanation |
|---|---|---|---|
| Wall time (ms) | 571 | 279 | The optimized layout improves cache usage and removes pointer chasing, roughly halving execution time. |
| Max RSS (KB) | 92,720 | 64,044 | Structure of Arrays reduces memory footprint by removing per-object overhead and cold fields. |
| Minor page faults | 22,655 | 15,500 | Fewer pages are touched due to more compact, contiguous storage of only needed data fields. |
| L1 cache hit rate (%) | 66.3 | 99.3 | Hot data is now accessed in a cache-friendly pattern, maximizing L1 cache effectiveness. |
| L1 avg latency (cycles) | 26.2 | 11.7 | Each L1 load takes fewer cycles because pointer chasing is removed. |
What you’ve accomplished
You used Arm Performix and the Arm MCP Server to identify a memory access bottleneck in a C++ particle simulation. You then connected the profile data to source code, found that the hot loop suffered from poor data layout and unnecessary pointer chasing, and improved the implementation with a Structure of Arrays layout. You validated the change with direct wall-time measurements and a second Performix run.
This approach combines measurement tools, code context, and focused prompts to iterate on real bottlenecks.