Optimize a sample C++ application on an Arm-based server with Arm Performix
Introduction
Set up Arm Performix
Build a sample C++ dot-product application
Find code hotspots in the scalar dot-product application
Identify CPU pipeline bottlenecks in the scalar dot-product application
Examine instruction patterns in the scalar dot-product application
Optimize the dot-product application with Arm Neon intrinsics
Validate the optimized dot-product application
Next Steps
Optimize a sample C++ application on an Arm-based server with Arm Performix
Introduction
Set up Arm Performix
Build a sample C++ dot-product application
Find code hotspots in the scalar dot-product application
Identify CPU pipeline bottlenecks in the scalar dot-product application
Examine instruction patterns in the scalar dot-product application
Optimize the dot-product application with Arm Neon intrinsics
Validate the optimized dot-product application
Next Steps
Run the recipes on the optimized binary
You can now compare the scalar and Neon-optimized versions using Arm Performix to validate changes in runtime, instruction mix, and bottleneck behavior.
Run each recipe one at a time by specifying the path to the optimized binary and the same parameters as before: performix-analysis/dot_neon 16777216 2000.
Compare Code Hotspots results
The exact results depend on your hardware, but the most visible improvement is wall-clock time and total cycle count. Processing four elements per loop iteration using SIMD reduces the total number of instructions executed. The flame graph shows the same dominant function (dot_neon), but the sample count is significantly lower.
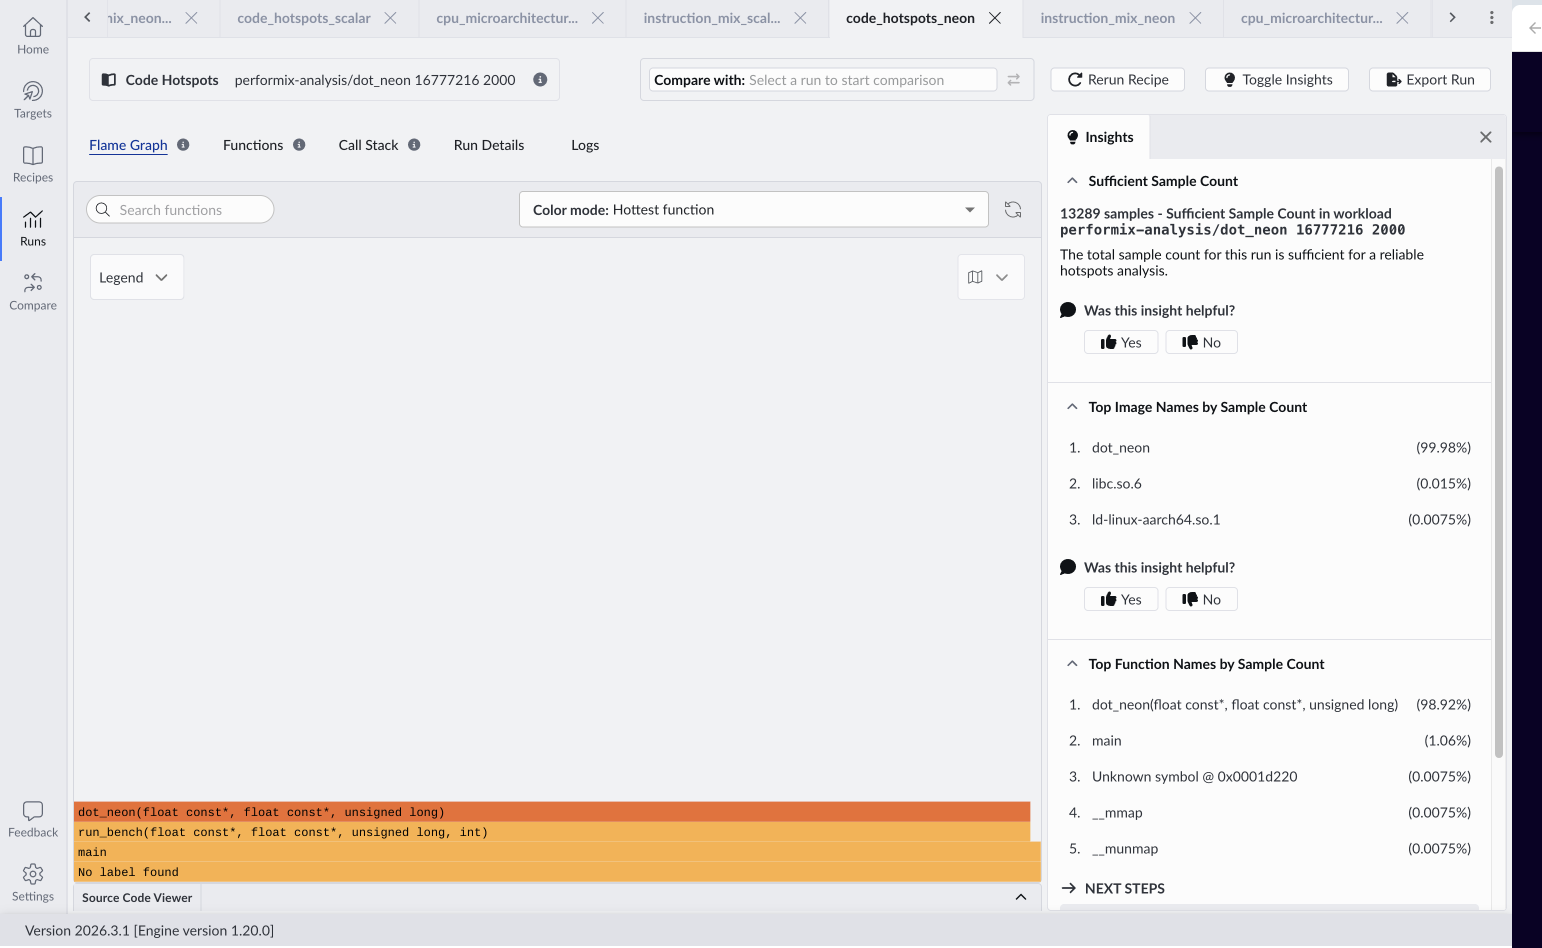 Code Hotspots flame graph for the Neon-optimized binary
Compare Instruction Mix results
Select the previous scalar Instruction Mix run to compare it with the optimized version side by side:
 Selecting the scalar Instruction Mix run from the Compare with control
The exact results depend on your hardware, but the overlay shows Advanced SIMD instructions appearing in the optimized version while scalar operations generally decrease. This confirms more work is done per instruction.
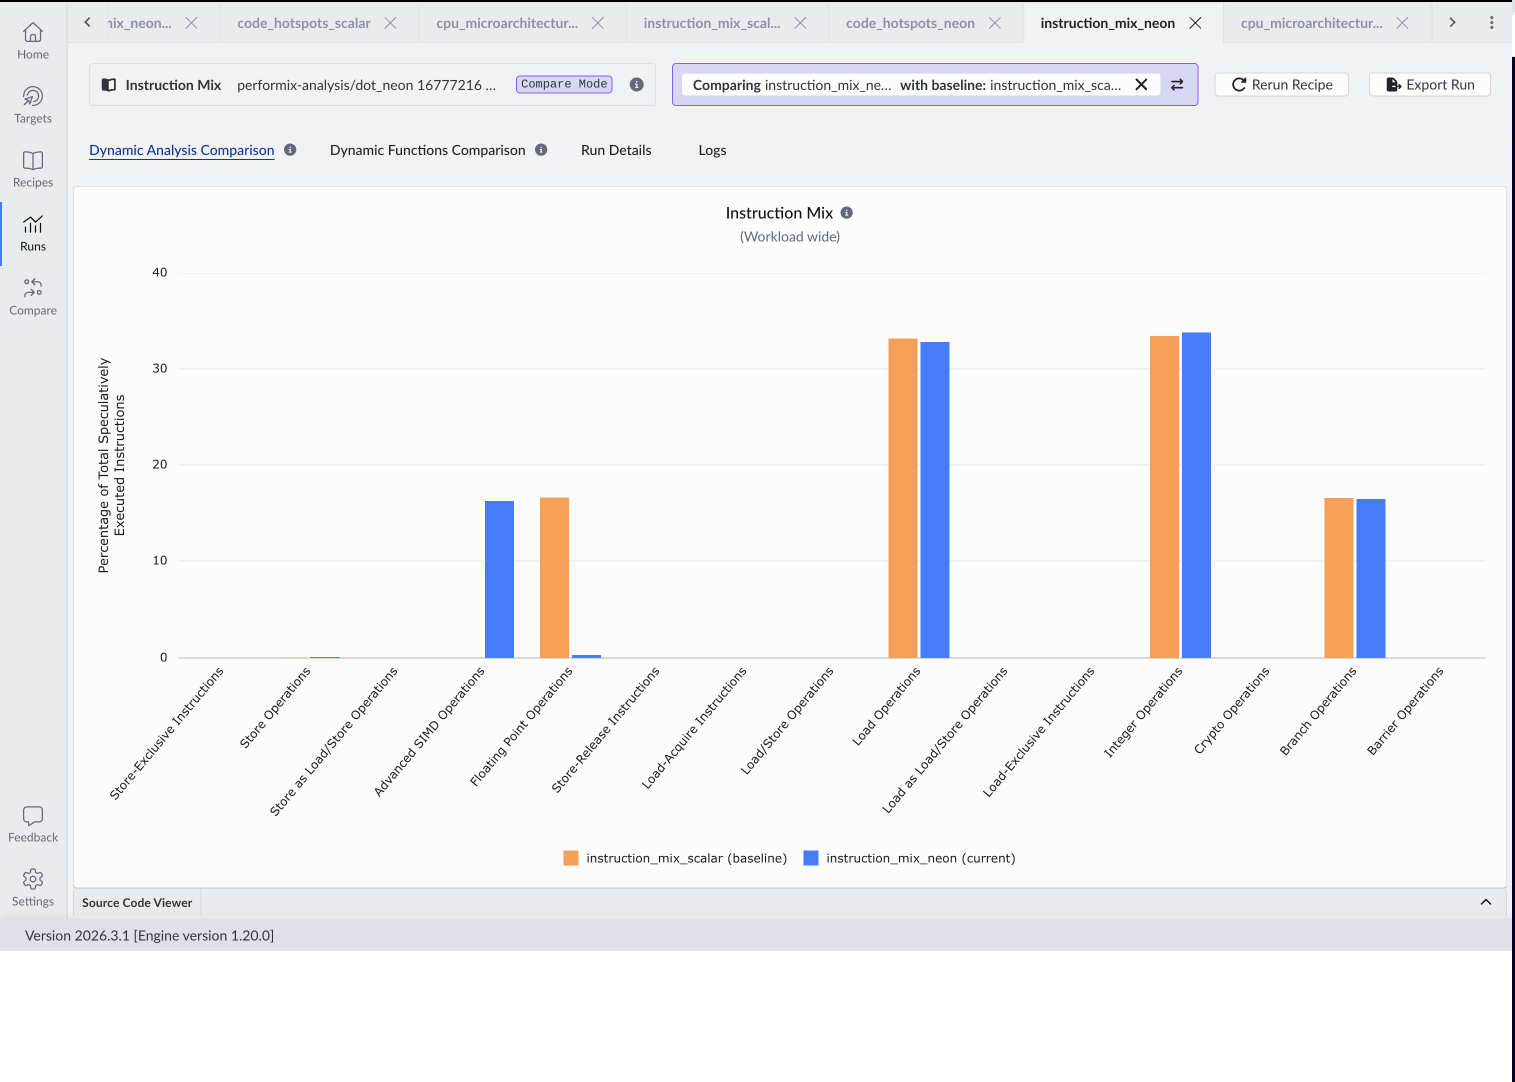 Instruction Mix for the Neon-optimized binary
The scalar version is dominated by floating-point and load operations. The Neon version introduces Advanced SIMD, reducing the number of instructions required per element and directly relieving frontend pressure.
Compare CPU Microarchitecture results
The CPU Microarchitecture recipe confirms the bottleneck has shifted. After vectorization, frontend stalled cycles drop and backend effects become dominant.
The exact results depend on your hardware. In this case, frontend stalls drop to zero, while backend stalls increase to ~47%.
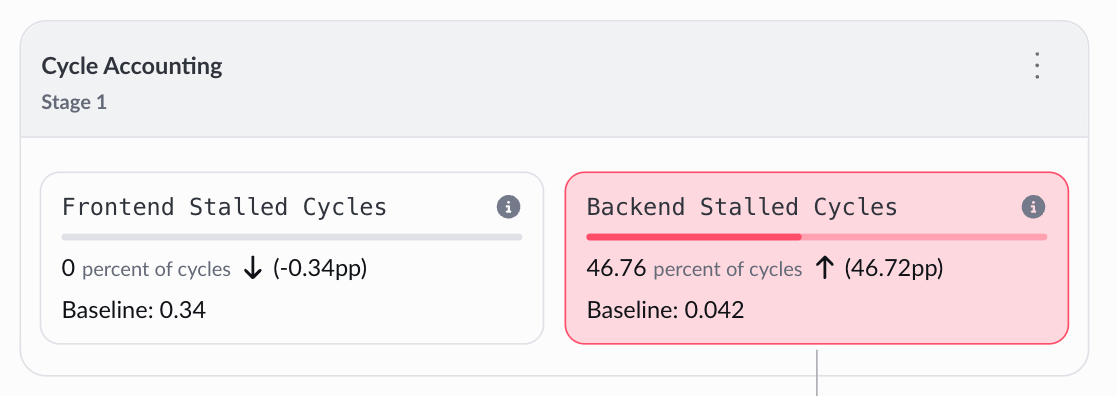 CPU Microarchitecture results for the Neon-optimized binary
This demonstrates a common pattern in performance optimization: improving one part of the pipeline shifts pressure elsewhere. With the bottleneck moved from the frontend to the backend, the CPU executes more efficiently. Demand shifts to execution units and memory.
What you’ve accomplished
You’ve compared performance between scalar and Neon-optimized versions of a C++ application using Arm Performix.
Now that you’ve completed a full optimization cycle, you can explore how to integrate Performix into broader development workflows and use these profiling steps for your own applications.