Deploy OpenTelemetry on Google Cloud C4A Axion processors
Introduction
Get started with OpenTelemetry on Google Axion C4A
Create firewall rules on GCP for Flask and observability components
Create a Google Axion C4A Arm virtual machine on GCP
Set up OpenTelemetry environment and application on Arm64
Deploy the OpenTelemetry observability stack on Arm64
Next Steps
Deploy OpenTelemetry on Google Cloud C4A Axion processors
Introduction
Get started with OpenTelemetry on Google Axion C4A
Create firewall rules on GCP for Flask and observability components
Create a Google Axion C4A Arm virtual machine on GCP
Set up OpenTelemetry environment and application on Arm64
Deploy the OpenTelemetry observability stack on Arm64
Next Steps
Overview
In this section, you will deploy and connect the OpenTelemetry Collector, Prometheus, and Jaeger to collect, store, and visualize telemetry data generated by the Flask microservice running on Arm64 infrastructure.
By the end of this section, you will have a complete observability pipeline for metrics and distributed tracing.
Architecture overview
Flask Microservice (Arm64)
        |
        | OpenTelemetry SDK
        v
OpenTelemetry Collector
   |            |
Metrics → Prometheus
Traces  → Jaeger
The Flask application sends telemetry to the OpenTelemetry Collector, which routes metrics to Prometheus and traces to Jaeger for monitoring and visualization.
Network and firewall requirements
Ensure the following ports are open on your VM firewall:
| Service | Port | Purpose |
|---|---|---|
| Prometheus | 9090 | Metrics dashboard UI |
| Jaeger UI | 16686 | Distributed tracing UI |
| Collector Metrics | 8889 | Prometheus scrape endpoint |
| OTLP gRPC | 4317 | Telemetry ingestion (gRPC) |
| OTLP HTTP | 4318 | Telemetry ingestion (HTTP) |
These ports enable telemetry ingestion and provide web interfaces for monitoring metrics and traces.
Configure OpenTelemetry Collector
This configuration defines how telemetry data is received from the Flask application and exported to Prometheus and Jaeger.
Navigate to your project directory:
cd ~/otel-demo
Create a file otel-collector-config.yaml with the following content:
receivers:
  otlp:
    protocols:
      grpc:
        endpoint: 0.0.0.0:4317
      http:
        endpoint: 0.0.0.0:4318

exporters:
  otlp:
    endpoint: jaeger:4317
    tls:
      insecure: true

  prometheus:
    endpoint: 0.0.0.0:8889

service:
  pipelines:
    traces:
      receivers: [otlp]
      exporters: [otlp]

    metrics:
      receivers: [otlp]
      exporters: [prometheus]
The Collector now receives OTLP telemetry and routes traces to Jaeger while exposing metrics for Prometheus scraping.
Configure Prometheus
This configuration instructs Prometheus to scrape metrics from the OpenTelemetry Collector.
Create a file prometheus.yml with the following content:
global:
  scrape_interval: 5s

scrape_configs:
  - job_name: "otel-collector"
    static_configs:
      - targets: ["otel-collector:8889"]
Prometheus will now periodically collect metrics generated by the Flask application via the Collector.
Create Docker Compose observability stack
Docker Compose orchestrates the Flask service, Collector, Prometheus, and Jaeger in a single deployment.
Create a file docker-compose.yml with the following content:
services:
  otel-demo-app:
    build: .
    ports:
      - "8080:8080"
    depends_on:
      - otel-collector

  otel-collector:
    image: otel/opentelemetry-collector-contrib:latest
    command: ["--config=/etc/otel-collector-config.yaml"]
    volumes:
      - ./otel-collector-config.yaml:/etc/otel-collector-config.yaml
    ports:
      - "4317:4317"
      - "4318:4318"
      - "8889:8889"

  jaeger:
    image: jaegertracing/all-in-one:latest
    ports:
      - "16686:16686"

  prometheus:
    image: prom/prometheus:latest
    volumes:
      - ./prometheus.yml:/etc/prometheus/prometheus.yml
    command:
      - "--config.file=/etc/prometheus/prometheus.yml"
    ports:
      - "9090:9090"
All observability components and the Flask application are now defined for automated deployment.
Launch the observability stack
Build the Flask image and start all services.
sudo /usr/local/bin/docker-compose up --build -d
Verify running containers:
docker ps
The output is similar to:
        CONTAINER ID   IMAGE                                         COMMAND                  CREATED        STATUS         PORTS                                                                                                                     NAMES
944ce1f16551   otel-demo-otel-demo-app                       "python app.py"          21 hours ago   Up 5 seconds   0.0.0.0:8080->8080/tcp, [::]:8080->8080/tcp                                                                               otel-demo-otel-demo-app-1
6cdc86f7d1a9   prom/prometheus:latest                        "/bin/prometheus --c…"   21 hours ago   Up 5 seconds   0.0.0.0:9090->9090/tcp, [::]:9090->9090/tcp                                                                               otel-demo-prometheus-1
a88d6979db39   otel/opentelemetry-collector-contrib:latest   "/otelcol-contrib --…"   21 hours ago   Up 5 seconds   0.0.0.0:4317-4318->4317-4318/tcp, [::]:4317-4318->4317-4318/tcp, 0.0.0.0:8889->8889/tcp, [::]:8889->8889/tcp, 55679/tcp   otel-demo-otel-collector-1
f4f7776b2201   jaegertracing/all-in-one:latest               "/go/bin/all-in-one-…"   21 hours ago   Up 5 seconds   4317-4318/tcp, 9411/tcp, 14250/tcp, 14268/tcp, 0.0.0.0:16686->16686/tcp, [::]:16686->16686/tcp                            otel-demo-jaeger-1
Expected services
- otel-demo-app
- otel-collector
- jaeger
- prometheus
The full observability stack is now running in containers on Arm64.
Generate application traffic
Send requests to the Flask service to produce telemetry data.
curl http://<VM_EXTERNAL_IP>:8080
Run a loop to generate more traffic:
for i in {1..10}; do curl http://<VM_EXTERNAL_IP>:8080; done
Each request generates traces and increments custom metrics.
The output is similar to:
        gcpuser@otel-suse-arm64:~/otel-demo> for i in {1..10}; do curl http://34.58.132.15:8080; done
Hello OpenTelemetry!Hello OpenTelemetry!Hello OpenTelemetry!Hello OpenTelemetry!Hello OpenTelemetry!Hello OpenTelemetry!Hello OpenTelemetry!Hello OpenTelemetry!Hello OpenTelemetry!Hello OpenTelemetry!gcpuser@otel-suse-arm64:~/otel-demo>
Validate metrics in Prometheus
Open Prometheus in your browser:
http://<VM_EXTERNAL_IP>:9090
Suggested Queries
- up
- demo_requests_total
Successful query results confirm that metrics are flowing correctly through the pipeline.
Prometheus metrics view
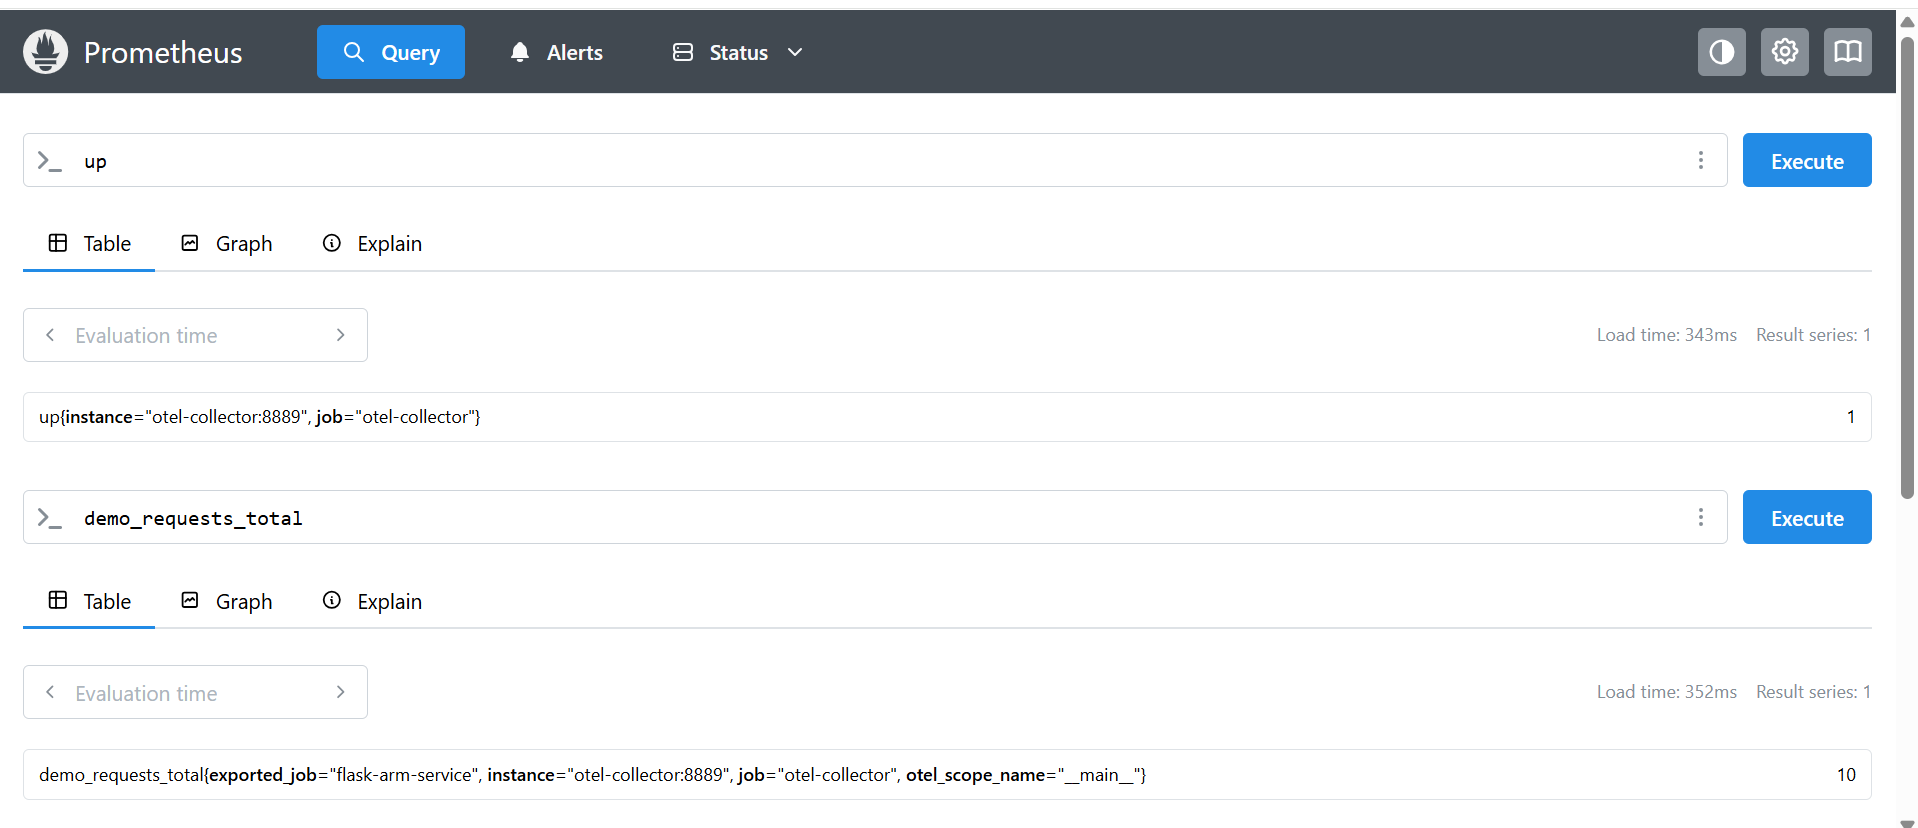 Prometheus confirming metrics from the OpenTelemetry Collector
This image confirms that Prometheus is successfully scraping metrics from the OpenTelemetry Collector, including the custom demo_requests_total counter generated by the Flask application.
Validate traces in Jaeger
Open Jaeger UI:
http://<VM_EXTERNAL_IP>:16686
Select the service:
flask-arm-service
Select Find Traces to view request traces.
You should now see distributed traces generated by the Flask microservice.
Jaeger distributed tracing view
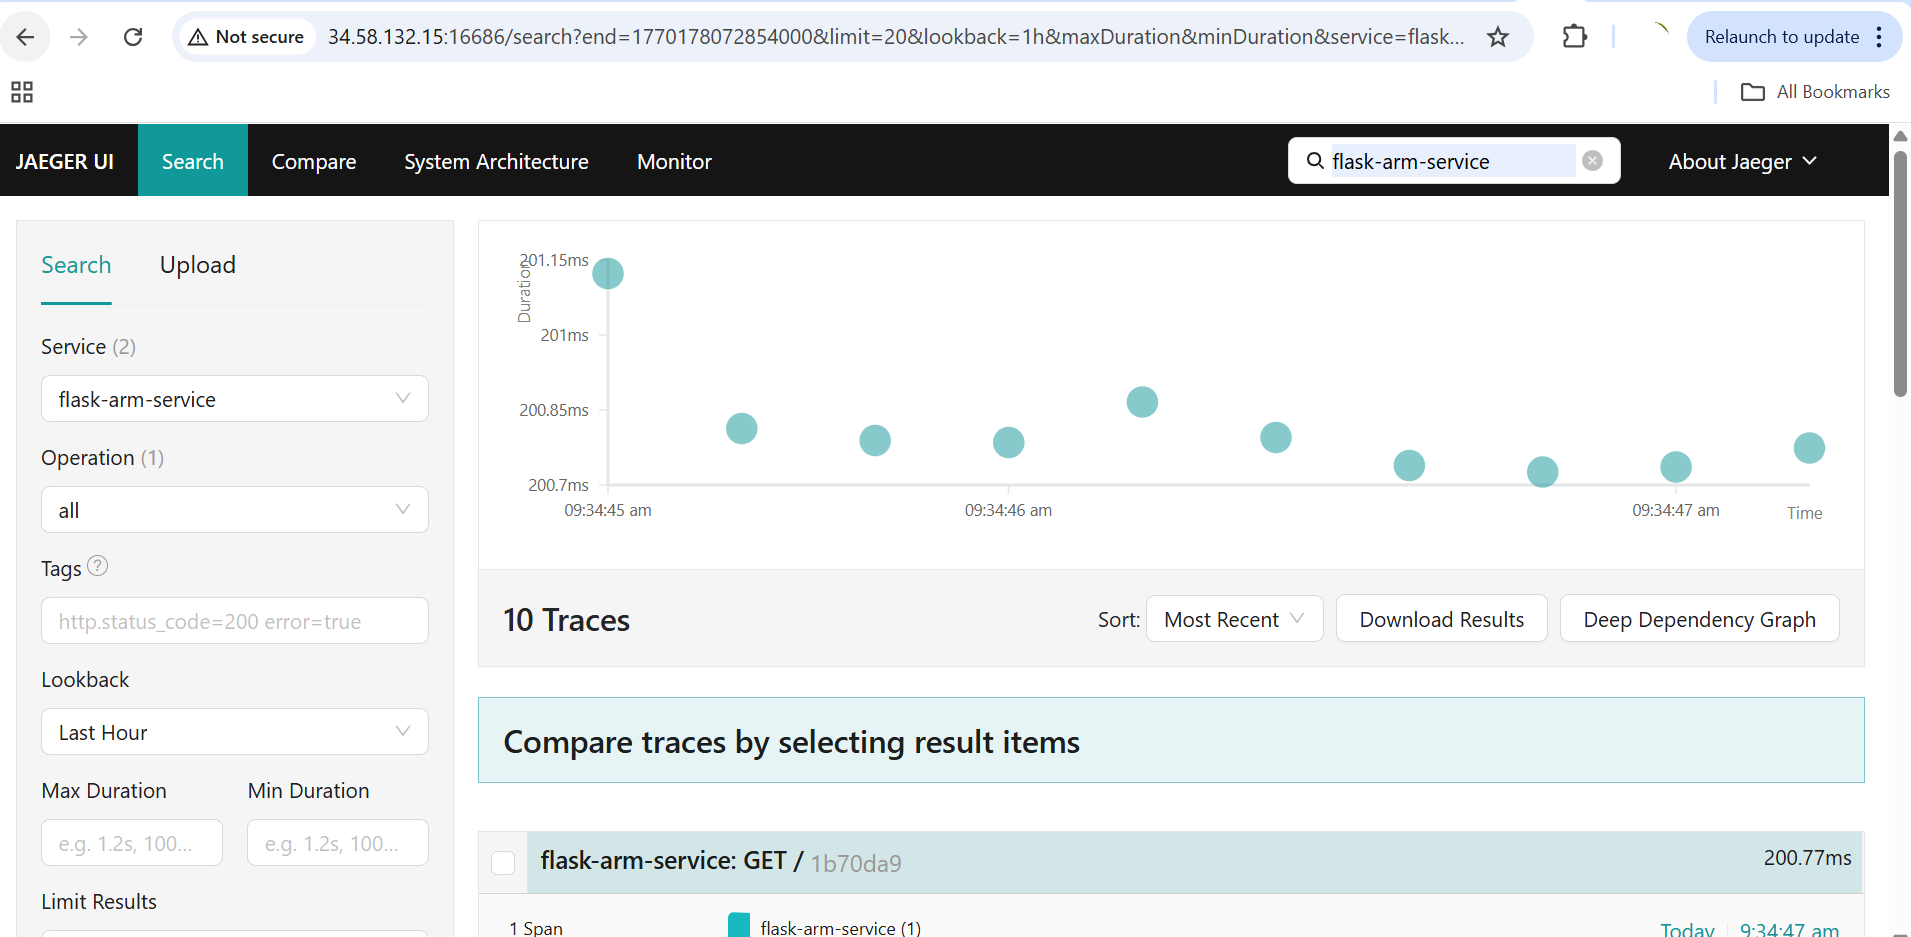 Distributed traces from the Flask microservice in Jaeger
This image shows distributed traces generated by the Flask microservice and collected via the OpenTelemetry pipeline, visualized in the Jaeger UI.
What you’ve accomplished and what’s next
In this section:
- You deployed the OpenTelemetry Collector, Prometheus, and Jaeger as a Docker Compose stack on Google Cloud C4A Axion
- You configured the Collector to route traces to Jaeger and metrics to Prometheus
- You generated traffic and validated the end-to-end telemetry pipeline
You now have a complete observability pipeline running natively on Arm infrastructure. From here, you can add custom metrics, set up alerting rules in Prometheus, or integrate additional exporters for your monitoring needs.