Accelerate random number generation with OpenRNG and Performix
Introduction
Set up your environment
Run the baseline data-processing example
Identify code hotspots with Arm Performix
Accelerate distribution generation with OpenRNG
Measure performance improvements with a microbenchmark
Next Steps
Accelerate random number generation with OpenRNG and Performix
Understand the workflow and run the baseline
The example workload demonstrates a data-processing pattern. The workflow processes synthetic 2D point data in three steps:
- Generate two random distributions and add them.
- Count how many points lie inside a rectangular window.
- Compute the shortest distance from the origin.
Although this is a toy example, these three steps represent a common pattern in analytics pipelines: generate data, filter data, and reduce data to a metric. You’ll find this pattern in real workloads such as geospatial event filtering or scientific simulation.
Open src/main.cpp to see this flow:
    // STEP 1. Generate a distribution of 2D Points that is the sum of a Gaussian and Uniform distribution

    const Vec1D distribution  = generateDistribution(NUM_POINTS, BASIC_RNG::GAUSSIAN, BASIC_RNG::UNIFORM, meanAndStdDeviationParams, minAndMaxParams);

    // STEP 2. Calculate the number of points that fit within a 2D window

    Rectangle window(10.0,10.0,50.0,50.0);
    int numberOfPoints = window.countPointsInRectangle(distribution);
    std::cout << "Number of Data Points = " << NUM_POINTS
              << " | Number of Points within Window ( ["
              << window.bottomLeft[0]  << ", " << window.bottomLeft[1] << "] , ["
              << window.topRight[0]  << ", " << window.topRight[1]
              << "] ) = " << numberOfPoints << std::endl;


    // STEP 3. Calculate the magnitude of the smallest point within the distribution

    float shortestDistance = min_length(distribution.getData());
    std::cout << "Shortest Distance from Origin = " << shortestDistance << std::endl;
Build and run the baseline executable:
cmake -S . -B build
cmake --build build --target main
./build/src/main
The output is similar to:
        Number of Data Points = 16384 | Number of Points within Window ( [10, 10] , [50, 50] ) = 586
Shortest Distance from Origin = 1.88536
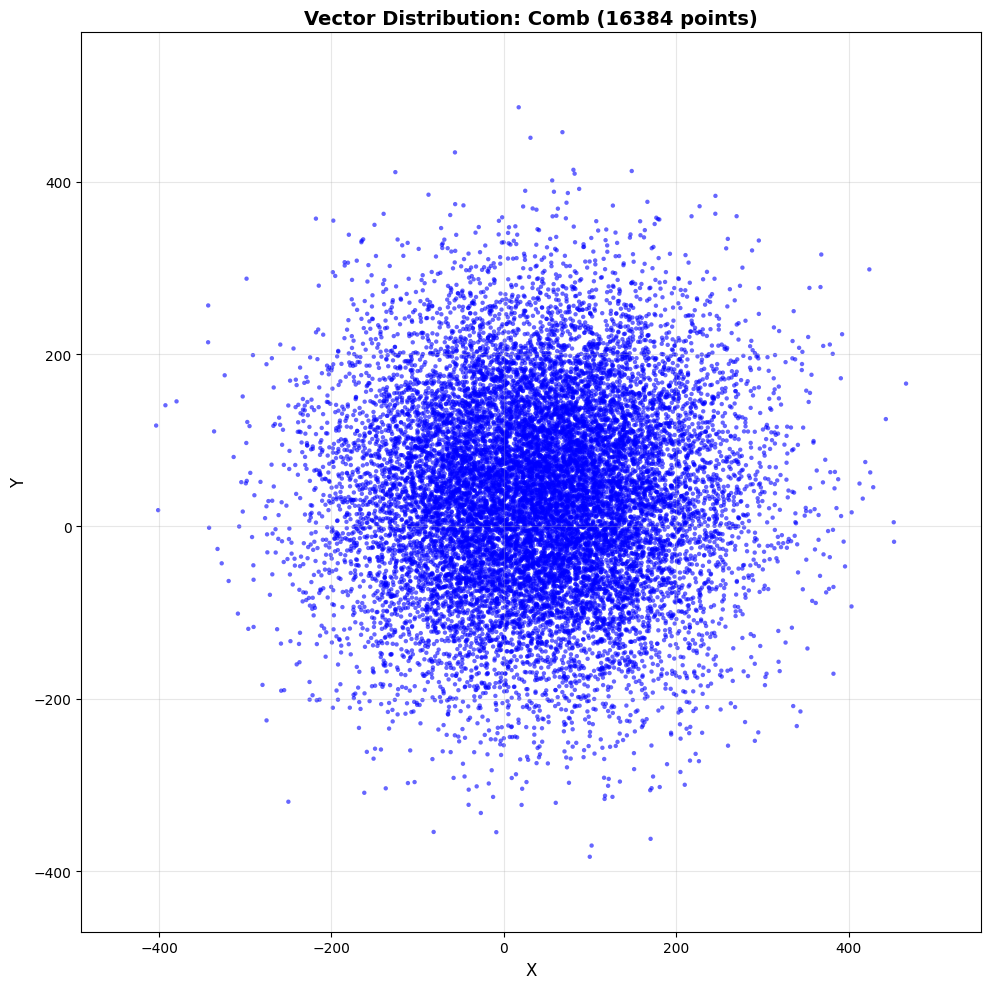
The example generates 16,384 points on an x and y axis. The distribution is the sum of a Gaussian distribution with a mean and standard deviation of 30 and 50 respectively, and a uniform distribution with a min and max of 10 and 100. For each point, the workload checks whether it lies within a window with bottom-left and top-right coordinates of [10,10] and [50,50] respectively. The workload then finds the point closest to the origin.
To confirm that the data distribution is being generated correctly, export the data and render it with a Python script:
cmake -S . -B build -DBUILD_TESTS=1
cmake --build build --target generate_visualization_baseline
./build/tests/generate_visualization_baseline
This writes vector_data.csv. Next, create a Python environment and render the plot:
python3 -m venv venv
source venv/bin/activate
pip3 install -r scripts/requirements.txt
python3 scripts/visualize_vectors.py
The script generates an image similar to this:
What you’ve accomplished and what’s next
In this section, you:
- Built and ran the baseline executable to confirm expected output
- Visualized the generated point distribution to verify the data is correct
Next, you’ll use Arm Performix Code Hotspots to profile the baseline and identify the optimization target from measured runtime data.