Build a multi-architecture Kubernetes cluster running nginx on Azure AKS
Introduction
Start your journey with Arm and x86 nginx workloads on a single Kubernetes cluster
Create the AKS cluster
Create the test utility
Deploy nginx on Intel x86
Deploy nginx on Arm
Deploy nginx multiarch service on AKS
Monitor performance with wrk and btop
Next Steps
Build a multi-architecture Kubernetes cluster running nginx on Azure AKS
Install btop monitoring tool on nginx pods
Now that you have all your nginx deployments running across Intel and Arm architectures, you can monitor performance across each architecture using wrk to generate load and btop to monitor system performance.
This Learning Path uses
wrk
to generate HTTP load testing. You can easily install wrk using apt or brew package managers.
If you prefer alternatives like
wrk2
(a modern fork with additional features) or other HTTP load generators, you can use those instead.
Install btop and apply optimized configuration
Run the following command to apply the configuration updates:
./nginx_util.sh put btop
You will see output similar to the following:
        Installing btop on all nginx pods...
Installing btop on nginx-amd-deployment-56b547bb47-vgbjj...
✓ btop installed on nginx-amd-deployment-56b547bb47-vgbjj
Installing btop on nginx-arm-deployment-66cb47ddc9-fgmsd...
✓ btop installed on nginx-arm-deployment-66cb547ddc9-fgmsd
Installing btop on nginx-intel-deployment-6f5bff9667-zdrqc...
✓ btop installed on nginx-intel-deployment-6f5bff9667-zdrqc
✅ btop installed on all pods!
The nginx_util.sh script includes a put config command that:
- Applies a performance-optimized nginx configuration to all pods
- Installs
btopmonitoring tool on all pods for system monitoring - Restarts pods with the new configuration
Check pod restart status
Check that all pods have restarted with the new configuration:
kubectl get pods -n nginx
You should see all pods with recent restart times.
Because pods are ephemeral, you need to reinstall btop if pods restart or get deleted. If you see a “btop not found” error, run ./nginx_util.sh put btop again to reinstall it.
Set up real-time performance monitoring
You can now log in to any pod and monitor system performance with btop. Many factors can affect workload performance, and btop (like top) is an excellent starting point for understanding these metrics.
Network performance can impact load testing accuracy when running from your local machine. If you experience low request rates (under 70,000 requests/s), consider running the test from an Azure VM in the same region as your cluster.
You can create an
Azure VM instance
and install the nginx_util.sh script there for more reliable results.
Running two btop terminals, one for each pod, is a convenient way to view performance in real time.
To bring up btop on both Arm and Intel pods, follow these steps:
- Open two new terminal windows
- In one terminal, run
login armfrom the nginx utility script to enter the pod - In the second terminal, run
login intelfrom thenginxutility script to enter the pod - Once inside each pod, run
btopto see real-time system monitoring
The commands are shown below.
For the Arm terminal:
./nginx_util.sh login arm
For the Intel terminal:
./nginx_util.sh login intel
In both terminals run:
btop --utf-force
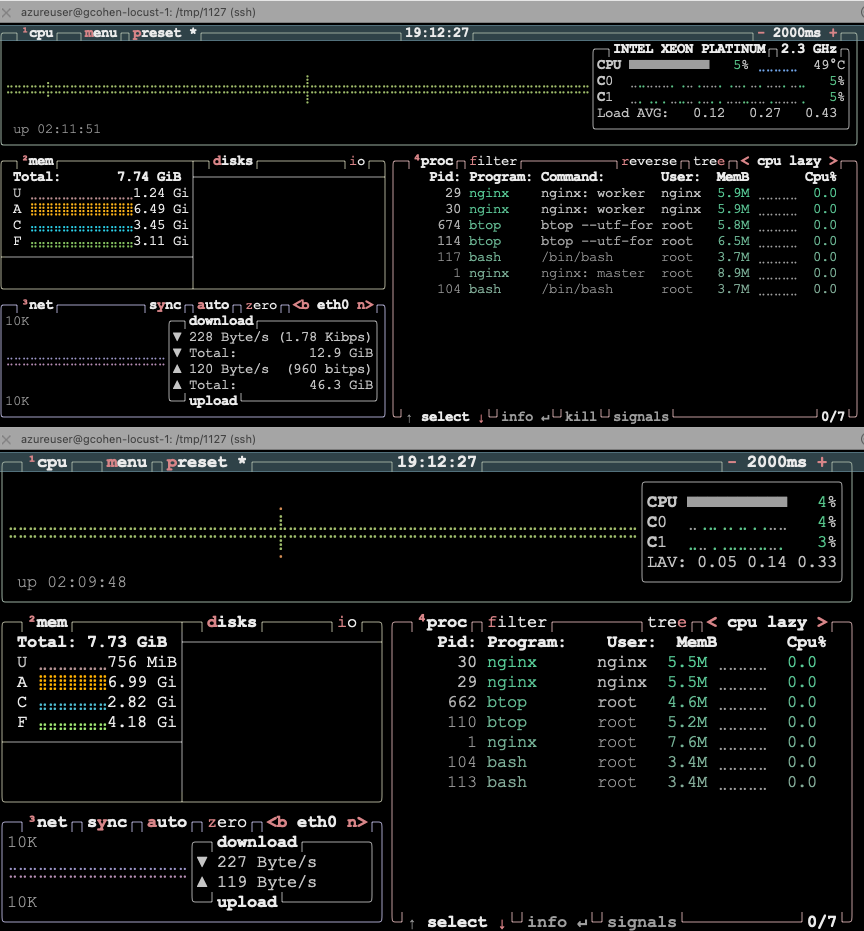
You should now see something similar to the image below, with one terminal for each Arm and Intel pod running btop:
To visualize performance with btop against the Arm and Intel pods using the load balancer service endpoints, you can use the nginx_util.sh wrapper to generate load to both simultaneously:
./nginx_util.sh wrk both
This runs wrk with predefined settings (1 thread, 50 simultaneous connections) to generate load to the K8s architecture-specific endpoints.
While it runs (for a default of 30s), you can observe some performance characteristics from the btop outputs:
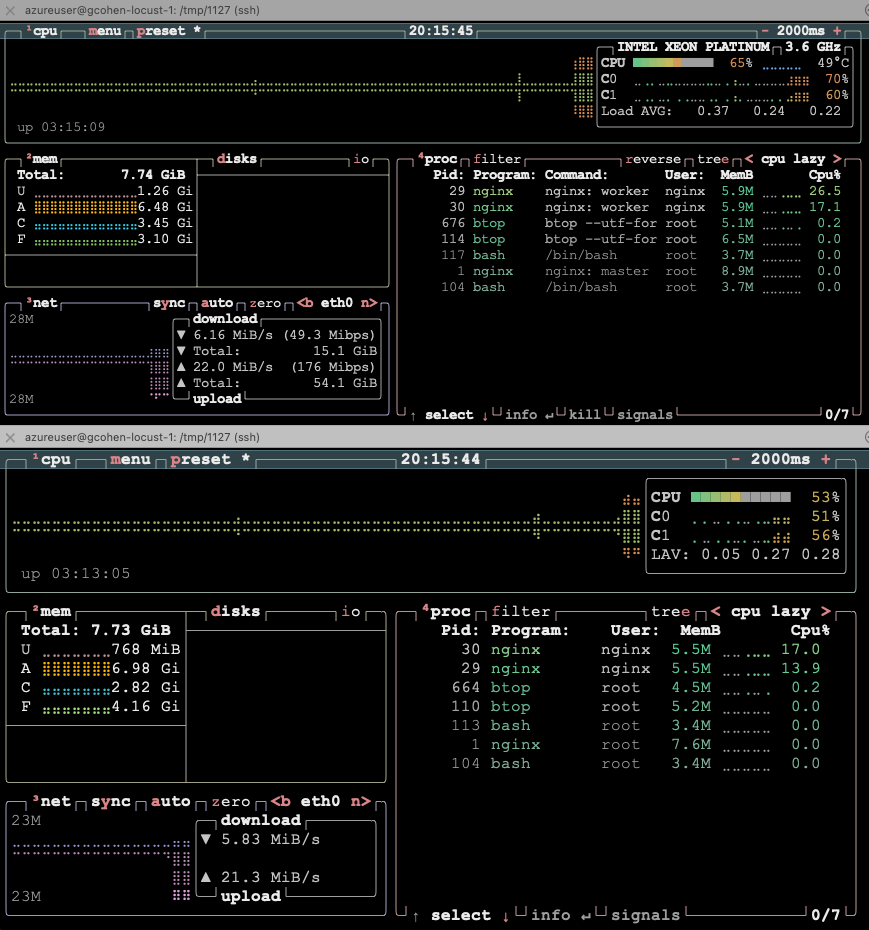
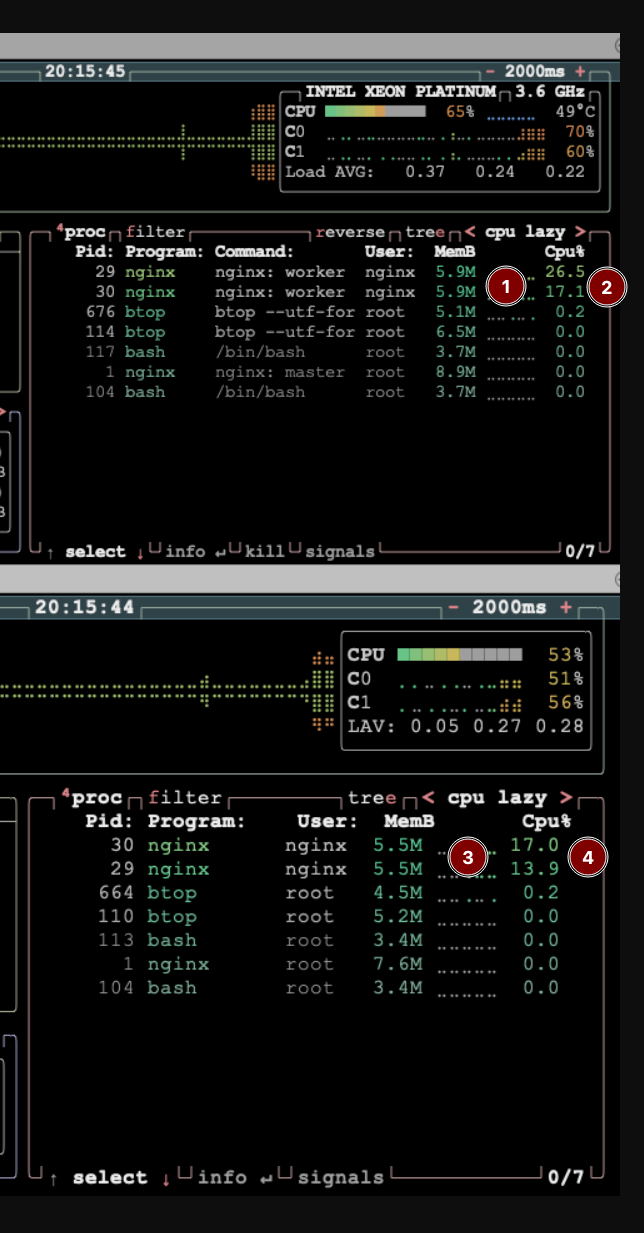
You can observe several performance characteristics from the btop outputs during load testing. Pay attention to the memory and CPU resource usage for each pod:
- Intel pod metrics: Memory usage (marker 1) and total CPU usage (marker 2)
- Arm pod metrics: Memory usage (marker 3) and total CPU usage (marker 4)
These real-time metrics help you compare how each architecture handles the load and resource consumption patterns.
In addition to the visual metrics, the script also returns runtime results including requests per second and latencies:
        Running wrk against both architectures in parallel...

Intel: wrk -t1 -c50 -d30 http://172.193.227.195/
ARM: wrk -t1 -c50 -d30 http://20.252.73.72/

========================================

INTEL RESULTS:
Running 30s test @ http://172.193.227.195/
  1 threads and 50 connections
  Thread Stats   Avg      Stdev     Max   +/- Stdev
    Latency   752.40us    1.03ms  28.95ms   94.01%
    Req/Sec    84.49k    12.14k  103.08k    73.75%
  2528743 requests in 30.10s, 766.88MB read
Requests/sec:  84010.86
Transfer/sec:     25.48MB

ARM RESULTS:
Running 30s test @ http://20.252.73.72/
  1 threads and 50 connections
  Thread Stats   Avg      Stdev     Max   +/- Stdev
    Latency   621.56us  565.90us  19.75ms   95.43%
    Req/Sec    87.54k    10.22k  107.96k    82.39%
  2620567 requests in 30.10s, 789.72MB read
Requests/sec:  87062.21
Transfer/sec:     26.24MB

========================================
Both tests completed
Customize load testing parameters
The nginx_util.sh script shows the results of the load generation, as well as the command lines used to generate them.
        ...
Intel: wrk -t1 -c50 -d30 http://172.193.227.195/
ARM: wrk -t1 -c50 -d30 http://20.252.73.72/
...
Feel free to experiment with by increasing and decreasing client threads, connections, and durations to better understand the performance characteristics under different scenarios.
For example, to generate load using 500 connections across 4 threads to the Arm service for 5 minutes (300s), you can use the following command:
wrk -t4 -c500 -d300 http://20.252.73.72/
What you’ve accomplished and what’s next
You have successfully deployed and monitored nginx workloads across both Arm and Intel architectures on Azure Kubernetes Service. You’ve learned how to generate load with wrk, monitor real-time performance with btop, and compare performance characteristics between different architectures.
You now have the knowledge to experiment with your own workloads on Arm-based AKS nodes to identify performance and efficiency opportunities unique to your own environments. Here are some ideas for further exploration:
- What do the performance curves look like between the two architectures as a function of load?
- How do larger instance types scale versus smaller ones?
Congratulations on completing this Learning Path! You’ve built a solid foundation for deploying and optimizing multi-architecture Kubernetes workloads on Azure, positioning yourself to take full advantage of Arm’s performance and cost benefits in your cloud infrastructure.