Analyze Java performance on Arm servers using flame graphs
Introduction
Set up Tomcat benchmark environment
Generate Java flame graphs using async-profiler
Generate Java flame graphs using a Java agent
Next Steps
Analyze Java performance on Arm servers using flame graphs
Overview
You can profile a Java application using perf by including a Java agent that enables symbol resolution. This allows perf to capture meaningful method names instead of raw memory addresses.
The required library is libperf-jvmti.so, a JVM Tool Interface (JVMTI) agent that bridges perf and the JVM. It ensures that stack traces collected during profiling can be accurately resolved to Java methods.
In this section, you’ll configure Tomcat to use this Java agent and generate a flame graph using the FlameGraph toolkit.
Locate the Java agent
Locate the libperf-jvmti.so library:
pushd /usr/lib
find . -name libperf-jvmti.so
popd
The output will show the path to the shared object file:
Modify Tomcat configuration
Open the Tomcat launch script using an editor of your choice:
apache-tomcat-${TOMCAT_VERSION}/bin/catalina.sh
Add the following line (replace the path if different on your system):
JAVA_OPTS="$JAVA_OPTS -agentpath:/usr/lib/linux-tools-6.8.0-63/libperf-jvmti.so -XX:+PreserveFramePointer"
Now shutdown and restart Tomcat:
pushd apache-tomcat-${TOMCAT_VERSION}/bin
./shutdown.sh
./startup.sh
popd
Run perf to record profiling data
Run the following command to record a 10-second profile of the Tomcat process:
PID=$(pgrep -f 'org.apache.catalina.startup.Bootstrap' | head -n1)
sudo perf record -g -k 1 -p "$PID" -- sleep 10
This generates a file named perf.data.
If needed, restart wrk on your x86 client to generate load during profiling.
Generate a flame graph
Clone the FlameGraph repository and add it to your PATH:
git clone https://github.com/brendangregg/FlameGraph.git
export PATH=$PATH:`pwd`/FlameGraph
sudo perf inject -j -i perf.data -o perf.jit.data
sudo perf script -i perf.jit.data | stackcollapse-perf.pl --all | flamegraph.pl --color=java --hash > profile.svg
View the result
You can now launch profile.svg in a browser to analyse the profiling result:
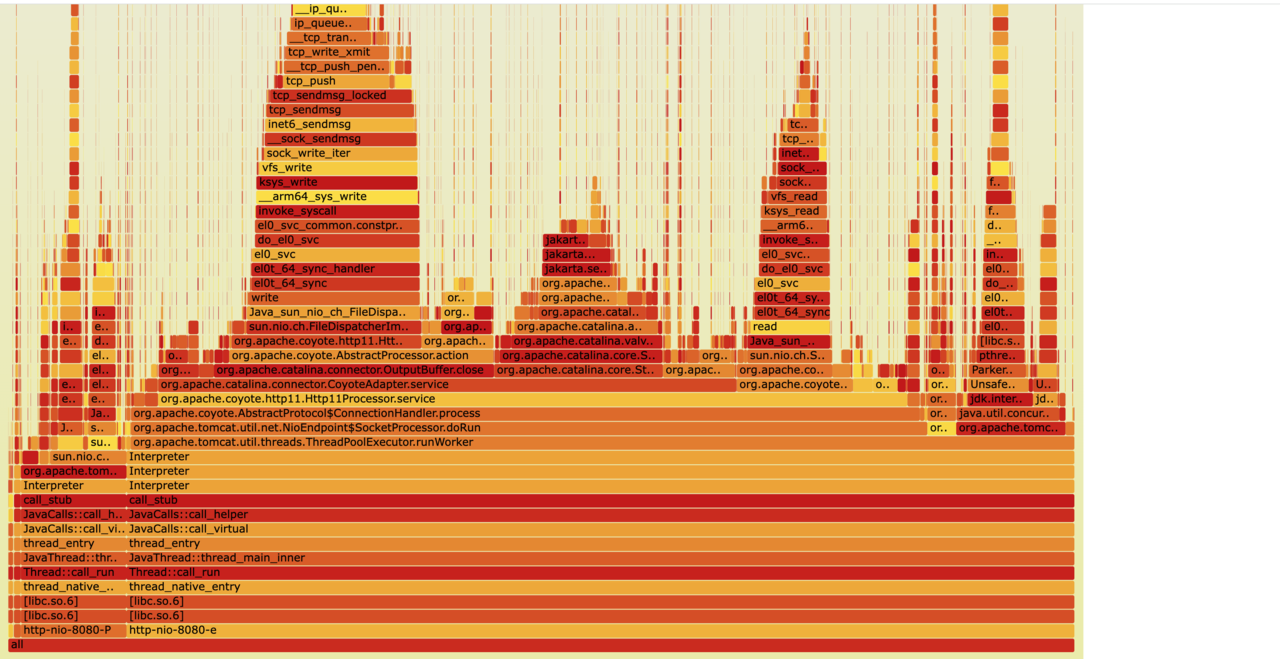 Java flame graph built through Java agent and perf