Analyze Java performance on Arm servers using flame graphs
Introduction
Set up Tomcat benchmark environment
Generate Java flame graphs using async-profiler
Generate Java flame graphs using a Java agent
Next Steps
Analyze Java performance on Arm servers using flame graphs
Overview
Async-profiler is a low-overhead sampling profiler for JVM applications. It can capture CPU usage, memory allocations, and lock events to generate flame graphs and detailed stack traces.
This tool is well-suited for production environments due to its minimal runtime impact. In this section, you’ll install and run async-profiler to analyze performance on your Tomcat instance under benchmark load.
Install and run async-profiler on the same Arm-based Linux machine where Tomcat is running to ensure accurate profiling.
Install async-profiler
Download and extract the latest release:
wget -c https://github.com/async-profiler/async-profiler/releases/download/v4.0/async-profiler-4.0-linux-arm64.tar.gz
tar xzf async-profiler-4.0-linux-arm64.tar.gz
Run the profiler
Navigate to the profiler binary directory:
cd async-profiler-4.0-linux-arm64/bin
Run async-profiler against the Tomcat process:
./asprof -d 10 -f profile.html $(jps | awk /Bootstrap/'{print $1}')
Alternatively, if you already know the process ID (PID):
./asprof -d 10 -f profile.html ${tomcat_process_id}
-d 10sets the profiling duration to 10 seconds-f profile.htmlspecifies the output file
View the flame graph
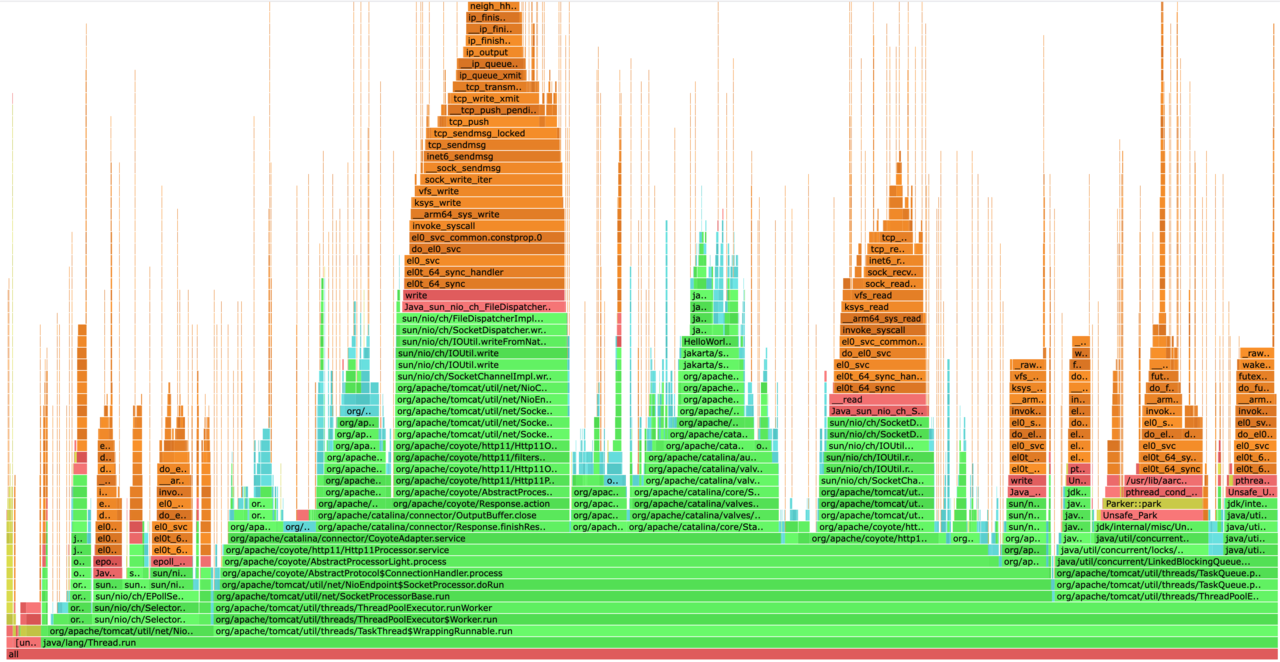
Open the generated profile.html file in a browser to view your Java flame graph:
 Java flame graph built using async-profiler