Analyze Java performance on Arm servers using flame graphs
Introduction
Set up Tomcat benchmark environment
Generate Java flame graphs using async-profiler
Generate Java flame graphs using a Java agent
Next Steps
Analyze Java performance on Arm servers using flame graphs
Overview
Flame graphs are a widely used entry point for analyzing Java application performance. Tools for generating flame graphs include async-profiler, Java agents, jstack, and Java Flight Recorder (JFR). This Learning Path focuses on two practical approaches: using async-profiler and a Java agent.
In this section, you’ll set up a benchmark environment using Apache Tomcat and wrk2 to simulate HTTP load and evaluate performance on an Arm-based server.
Set up the Tomcat benchmark server
Apache Tomcat is an open-source Java Servlet container that runs Java web applications, handles HTTP requests, and serves dynamic content. It supports technologies such as Servlet, JSP, and WebSocket.
Install the Java Development Kit (JDK)
Install OpenJDK 21 on your Arm-based Ubuntu server:
sudo apt update
sudo apt install -y openjdk-21-jdk
Install Tomcat
Download and extract Tomcat:
wget -c https://dlcdn.apache.org/tomcat/tomcat-11/v11.0.9/bin/apache-tomcat-11.0.9.tar.gz
tar xzf apache-tomcat-11.0.9.tar.gz
Alternatively, you can build Tomcat from source .
Enable access to Tomcat examples
To access the built-in examples from your local network or external IP, use a text editor to modify the context.xml file by updating the RemoteAddrValve configuration to allow all IP addresses.
The file is at:
apache-tomcat-11.0.9/webapps/examples/META-INF/context.xml
Start the Tomcat server
Start the server:
./apache-tomcat-11.0.9/bin/startup.sh
You should see output like:
        Using CATALINA_BASE:   /home/ubuntu/apache-tomcat-11.0.9
Using CATALINA_HOME:   /home/ubuntu/apache-tomcat-11.0.9
Using CATALINA_TMPDIR: /home/ubuntu/apache-tomcat-11.0.9/temp
Using JRE_HOME:        /usr
Using CLASSPATH:       /home/ubuntu/apache-tomcat-11.0.9/bin/bootstrap.jar:/home/ubuntu/apache-tomcat-11.0.9/bin/tomcat-juli.jar
Using CATALINA_OPTS:
Tomcat started.
Confirm server access
In your browser, open: http://${tomcat_ip}:8080/examples.
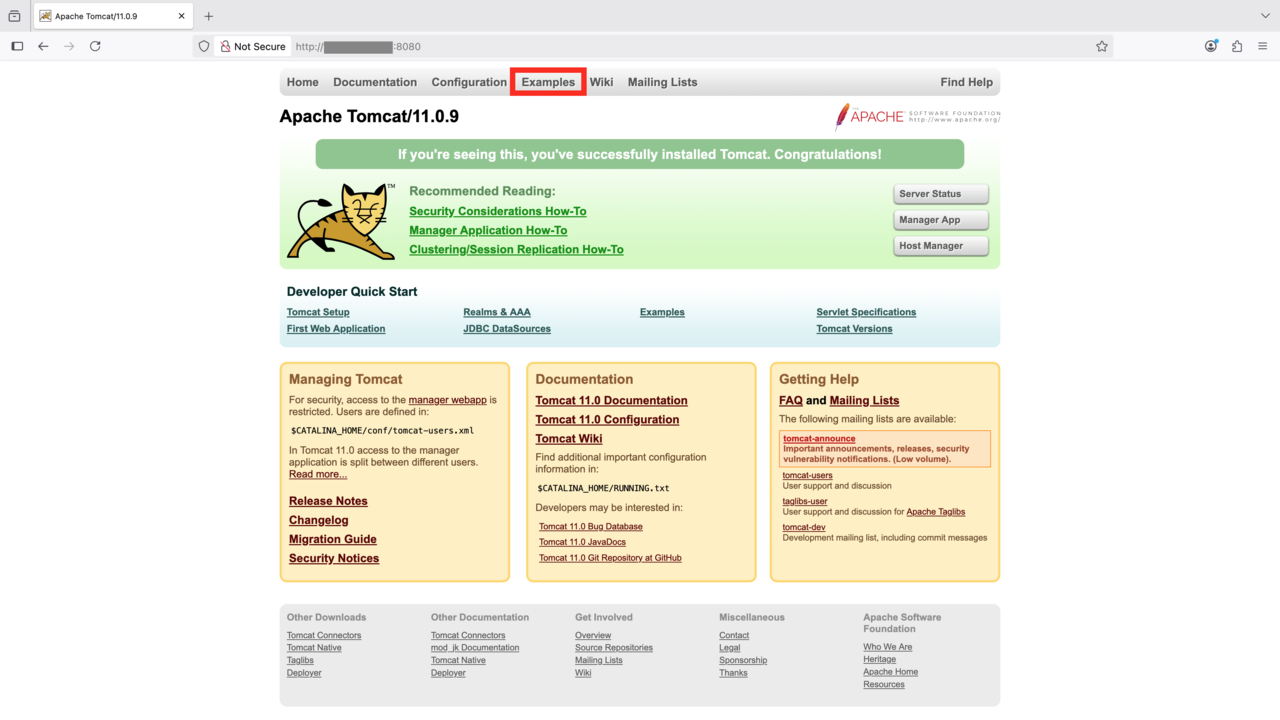
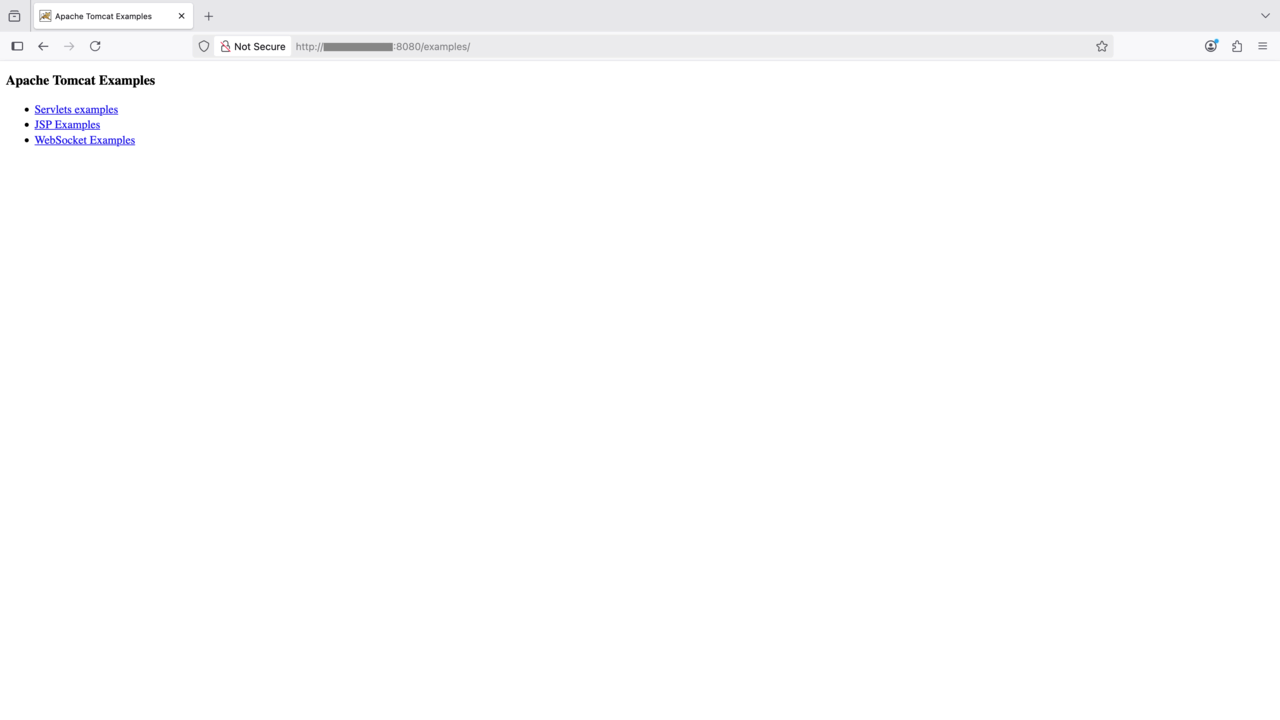
You should see the Tomcat welcome page and examples, as shown below:
 Apache Tomcat homepage
 Apache Tomcat examples
Set up the benchmarking client using wrk2
Wrk2
is a high-performance HTTP benchmarking tool specialized in generating constant throughput loads and measuring latency percentiles for web services. wrk2 is an enhanced version of wrk that provides accurate latency statistics under controlled request rates, ideal for performance testing of HTTP servers.
Currently wrk2 is only supported on x86 machines. Run the benchmark client steps below on an x86_64 server running Ubuntu.
Install dependencies
Install the required packages:
sudo apt-get update
sudo apt-get install -y build-essential libssl-dev git zlib1g-dev
Clone and build wrk2
Clone the repository and compile the tool:
sudo git clone https://github.com/giltene/wrk2.git
cd wrk2
sudo make
Move the binary to a directory in your system’s PATH:
sudo cp wrk /usr/local/bin
Run the benchmark
Use the following command to benchmark the HelloWorld servlet running on Tomcat:
wrk -c32 -t16 -R50000 -d60 http://${tomcat_ip}:8080/examples/servlets/servlet/HelloWorldExample
You should see output similar to:
Running 1m test @ http://172.26.203.139:8080/examples/servlets/servlet/HelloWorldExample
  16 threads and 32 connections
  Thread calibration: mean lat.: 0.986ms, rate sampling interval: 10ms
  Thread calibration: mean lat.: 0.984ms, rate sampling interval: 10ms
  Thread calibration: mean lat.: 0.999ms, rate sampling interval: 10ms
  Thread calibration: mean lat.: 0.994ms, rate sampling interval: 10ms
  Thread calibration: mean lat.: 0.983ms, rate sampling interval: 10ms
  Thread calibration: mean lat.: 0.989ms, rate sampling interval: 10ms
  Thread calibration: mean lat.: 0.991ms, rate sampling interval: 10ms
  Thread calibration: mean lat.: 0.993ms, rate sampling interval: 10ms
  Thread calibration: mean lat.: 0.985ms, rate sampling interval: 10ms
  Thread calibration: mean lat.: 0.990ms, rate sampling interval: 10ms
  Thread calibration: mean lat.: 0.987ms, rate sampling interval: 10ms
  Thread calibration: mean lat.: 0.990ms, rate sampling interval: 10ms
  Thread calibration: mean lat.: 0.984ms, rate sampling interval: 10ms
  Thread calibration: mean lat.: 0.991ms, rate sampling interval: 10ms
  Thread calibration: mean lat.: 0.978ms, rate sampling interval: 10ms
  Thread calibration: mean lat.: 0.976ms, rate sampling interval: 10ms
  Thread Stats   Avg      Stdev     Max   +/- Stdev
    Latency     1.00ms  454.90us   5.09ms   63.98%
    Req/Sec     3.31k   241.68     4.89k    63.83%
  2999817 requests in 1.00m, 1.56GB read
Requests/sec:  49997.08
Transfer/sec:     26.57MB