Benchmark Go performance with Sweet and Benchstat
Introduction
Overview
Launch an Arm-based c4a-standard-4 instance
Launch an Intel Emerald Rapids c4-standard-8 instance
Install Go, Sweet, and Benchstat
Benchmark types and metrics
Manually run benchmarks
Manually run Benchstat
Install the automated benchmark and Benchstat runner
Run the automated benchmark and Benchstat runner
Next Steps
You’ve successfully run and downloaded the benchmark results from both your Arm-based and x86-based VMs. In this section, you’ll use Benchstat to compare performance between the two instances.
Inspect the results files
To understand what Benchstat analyzes, open the results files to view the raw benchmark output.
Open the c4a.result file in a text editor. You should see something like this:
 A results file
The file contains the results of the markdown benchmark run on the Arm-based c4a VM, showing time and memory stats taken for each iteration. If you open the c4.result file, you’ll see similar results for the x86-based c4 VM.
Close the text editor when done.
Run Benchstat to compare results
To compare the results, you’ll now use Benchstat to analyze the two result files you downloaded. Since all the prerequisites are already installed on the c4 and c4a instances, Benchstat will be run from one of those instances.
Create working directory
Make a temporary benchstat directory to hold the results files on either the c4a or c4 instance, and change directory into it:
mkdir benchstat_results
cd benchstat_results
Upload results files
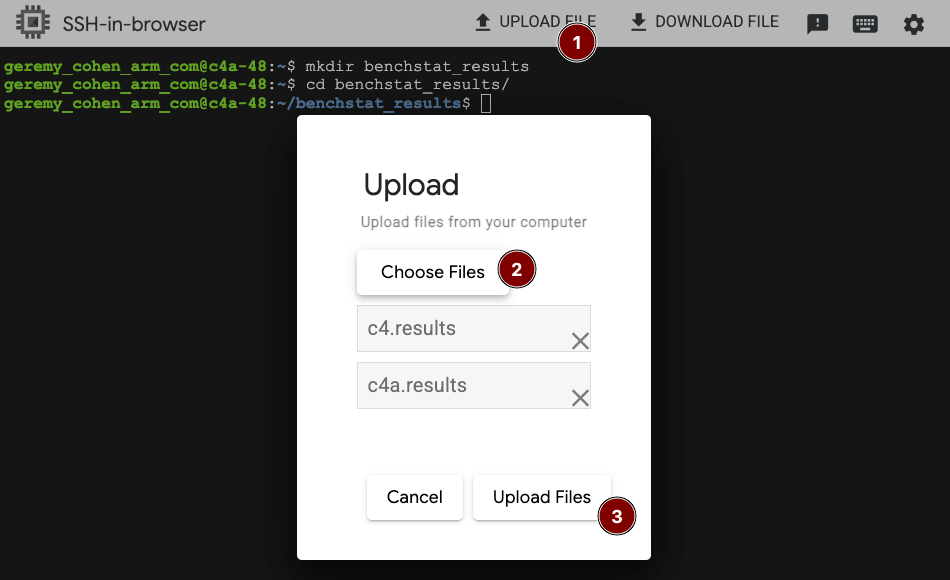
Click the UPLOAD FILE button in the GCP console, and upload the c4a.results AND c4.results files you downloaded earlier. (This uploads them to your home directory, not to the current directory.)
 Upload results file
Verify upload
You’ll know it worked correctly via the confirmation dialog in your terminal:
 Confirmation dialog in terminal
Move files to working directory
Move the results files to the benchstat_results directory, and confirm their presence:
mv ~/c4a.results ~/c4.results .
ls -al
You should see both files in the benchstat_results directory:
c4.results c4a.results
Run benchstat
Now you can run benchstat to compare the two results files:
export GOPATH=$HOME/go
export GOBIN=$GOPATH/bin
export PATH=$PATH:$GOBIN:/usr/local/go/bin
benchstat c4a.results c4.results > c4a_vs_c4.txt
View comparison results
Run the cat command to view the results:
cat c4a_vs_c4.txt
You should see output similar to the following:
                               │ c4a.results │     c4.results     │
                       │   sec/op    │   sec/op     vs base   │
MarkdownRenderXHTML-48   143.9m ± 1%
MarkdownRenderXHTML-96                 158.3m ± 0%
geomean                  143.9m        158.3m       ? ¹ ²
¹ benchmark set differs from baseline; geomeans may not be comparable
² ratios must be >0 to compute geomean

                       │    c4a.results    │        c4.results        │
                       │ average-RSS-bytes │ average-RSS-bytes  vs base   │
MarkdownRenderXHTML-48        22.49Mi ± 6%
MarkdownRenderXHTML-96                            24.78Mi ± 2%
geomean                       22.49Mi             24.78Mi       ? ¹ ²
¹ benchmark set differs from baseline; geomeans may not be comparable
² ratios must be >0 to compute geomean

                       │  c4a.results   │      c4.results       │
                       │ peak-RSS-bytes │ peak-RSS-bytes  vs base   │
MarkdownRenderXHTML-48     23.67Mi ± 4%
MarkdownRenderXHTML-96                      25.11Mi ± 7%
geomean                    23.67Mi          25.11Mi       ? ¹ ²
¹ benchmark set differs from baseline; geomeans may not be comparable
² ratios must be >0 to compute geomean

                       │  c4a.results  │      c4.results      │
                       │ peak-VM-bytes │ peak-VM-bytes  vs base   │
MarkdownRenderXHTML-48    1.176Gi ± 0%
MarkdownRenderXHTML-96                    1.176Gi ± 0%
geomean                   1.176Gi         1.176Gi       ? ¹ ²
¹ benchmark set differs from baseline; geomeans may not be comparable
² ratios must be >0 to compute geomean
This output shows the performance differences between the two VMs for the markdown benchmark in text format. The key metrics to observe are:
- sec/op: Shows the execution time per operation (lower is better)
- average-RSS-bytes: Shows the average resident set size memory usage (lower is better)
- peak-RSS-bytes: Shows the maximum resident set size memory usage (lower is better)
- peak-VM-bytes: Shows the maximum virtual memory usage (lower is better)
In this example, you can see that the c4a (Arm) instance completed the markdown benchmark in 143.9m seconds, while the c4 (x86) instance took 158.3m seconds, indicating better performance on the Arm system for this particular workload.
If you want the results in CSV format, you can run the benchstat command with the -format csv option instead.
At this point, you can download the c4a_vs_c4.txt for further analysis or reporting. You can also run the same or different benchmarks with the same, or different combinations of VMs, and continue comparing results using benchstat.
In the next section, you will learn how to automate and gain enhanced visuals with sweet and benchstat.