Microbenchmark storage performance with fio on Arm
Introduction
Fundamentals of storage systems
Analyzing I/O behavior with real workloads
Benchmarking block storage performance with fio
Next Steps
Microbenchmark storage performance with fio on Arm
Install fio
You can use the same t4g.medium instance from the previous section with two different types of SSD-based block storage devices as shown in the console screenshot below.
Attach and Identify Block Devices
To add the required EBS volumes to your EC2 instance:
In the AWS Console, navigate to EC2 > Volumes > Create Volume.
Create a volume with the following settings:
- Volume Type: io2 (Provisioned IOPS SSD).
- Size: 8 GiB.
- IOPS: 400.
- Availability Zone: The same as your EC2 instance
Create another volume with the following settings:
- Volume Type: gp2 (General Purpose SSD).
- Size: 8 GiB.
- Availability Zone: The same as your EC2 instance.
Once created, select each volume and choose Actions > Attach Volume.
Select your t4g.medium instance from the dropdown and attach each volume.
Both block devices have the same 8 GiB capacity, but the io2 is optimized for throughput, while gp2 is general-purpose.
 Multi-volume storage information.
In this section, you’ll measure real-world performance to help guide your storage selection.
Flexible I/O (fio) is a command-line tool to generate a synthetic workload with specific I/O characteristics. This serves as a simpler alternative to full record and replay testing.
Fio is available through most Linux distribution packages, see the documentation for package availability.
sudo apt update
sudo apt install fio -y
Confirm installation with the following command:
fio --version
The version is printed:
fio-3.37
Identify Device Names for Benchmarking
Fio allows you to microbenchmark either the block device or a mounted filesystem. Use the disk free, df command to confirm your EBS volumes are not mounted. Writing to drives containing critical data can result in data loss. In this tutorial, you’re writing to blank, unmounted block devices.
Use the lsblk command to view the EBS volumes attached to the server (nvme1n1 and nvme2n1). The immediate number appended to nvme, e.g., nvme0, shows it is a physically separate device. nvme1n1 corresponds to the faster io2 block device and nvme2n1 corresponds to the slower gp2 block device.
lsblk -e 7
        NAME         MAJ:MIN RM  SIZE RO TYPE MOUNTPOINTS
nvme1n1      259:0    0    8G  0 disk
nvme0n1      259:1    0    8G  0 disk
├─nvme0n1p1  259:3    0    7G  0 part /
├─nvme0n1p15 259:4    0   99M  0 part /boot/efi
└─nvme0n1p16 259:5    0  923M  0 part /boot
nvme2n1      259:2    0    8G  0 disk
If you have more than one block volume attached to an instance, the sudo nvme list command from the nvme-cli package can be used to differentiate between volumes
Generating a synthetic workload
Let’s define a synthetic workload that mimics the behavior of a logging application, using metrics observed earlier.
This workload involves light, sequential reads and writes. The system write throughput per thread is 5 MB/s with 83% writes. There are infrequent bursts of reads for approximately 5 seconds, operating at up to 16MB/s per thread. The workload can scale the infrequent reads and writes to use up to 16 threads each. The block size for the writes and reads are 64KiB and 256KiB respectively (as opposed to the standard 4KiB Page size).
Further, the application is latency sensitive and given it holds critical information, needs to write directly to non-volatile storage through direct IO.
The fio tool uses simple configuration files - called jobfiles - to describe the characteristics of your synthetic workload. Parameters under the [global] option are shared among jobs. From the example below, you can create 2 jobs to represent the steady write and infrequent reads. Please refer to the official
documentation
for more details.
Create fio Job Files
Create two job files, one for each device, by copying the configuration below and adjusting the filename parameter (/dev/nvme1n1 or /dev/nvme2n1):
 ; -- start job file including.fio --
[global]
ioengine=libaio
direct=1 ; write directly to the drive
time_based
runtime=30
group_reporting=1
log_avg_msec=1000
rate=16m,5m ; limit to 16 MB/s and 5MB/s for read and write per job
numjobs=${NUM_JOBS} ; set at the command line
iodepth=${IO_DEPTH} ; set at the command line
filename=/dev/nvme1n1 ; or nvme2n1

[steady_write]
name=steady_write
rw=write ; sequential write
bs=64k ; Block size of 64KiB (default block size of 4 KiB)

[burst_read]
name=burst_read
rw=read
bs=256k ; Block size of 256KiB for reads (default is 4KiB)
startdelay=25 ; simulate a 5-second read burst at the end of a 30-second window
runtime=5
; -- end job file including.fio --
Run the Benchmarks
Running fio directly on block devices requires root privileges (hence the use of sudo). Be careful: writing to the wrong device can result in data loss. Always ensure you are targeting a blank, unmounted device.
Run the following commands to execute each test sequentially:
sudo NUM_JOBS=16 IO_DEPTH=64 fio nvme1.fio
Then run again with the following command:
sudo NUM_JOBS=16 IO_DEPTH=64 fio nvme2.fio
Interpreting Results
The final terminal output from both runs are shown below.
        nvme1:

Run status group 0 (all jobs):
   READ: bw=118MiB/s (124MB/s), 118MiB/s-118MiB/s (124MB/s-124MB/s), io=629MiB (660MB), run=5324-5324msec
  WRITE: bw=80.0MiB/s (83.9MB/s), 80.0MiB/s-80.0MiB/s (83.9MB/s-83.9MB/s), io=2400MiB (2517MB), run=30006-30006msec

Disk stats (read/write):
  nvme1n1: ios=2663/38225, sectors=1294480/4892800, merge=0/0, ticks=148524/454840, in_queue=603364, util=62.19%

nvme2:

Run status group 0 (all jobs):
   READ: bw=85.6MiB/s (89.8MB/s), 85.6MiB/s-85.6MiB/s (89.8MB/s-89.8MB/s), io=456MiB (478MB), run=5322-5322msec
  WRITE: bw=60.3MiB/s (63.2MB/s), 60.3MiB/s-60.3MiB/s (63.2MB/s-63.2MB/s), io=1816MiB (1904MB), run=30119-30119msec

Disk stats (read/write):
  nvme2n1: ios=1872/28855, sectors=935472/3693440, merge=0/0, ticks=159753/1025104, in_queue=1184857, util=89.83%
fio reports bandwidth in MiB/s (mebibytes per second). MB/s (megabytes per second) is included for comparison. 1 MiB = 1,048,576 bytes, while 1 MB = 1,000,000 bytes.
Here you can see that the faster io2 block storage (nvme1) is able to meet the throughput requirement of 80MB/s for steady writes when all 16 write threads are running (5MB/s per thread). However, gp2 saturates at 60.3 MiB/s with over 89.8% SSD utilization.
Suppose your fictional logging application is sensitive to operation latency. The output below highlights that over ~35% of operations have a latency above 1s on nvme2 compared to ~7% on nvme1. High latency percentiles can significantly impact application responsiveness, especially for latency-sensitive workloads like logging.
  nvme2:

  lat (usec)   : 10=0.01%, 500=1.53%, 750=5.13%, 1000=7.55%
  lat (msec)   : 2=29.49%, 4=0.89%, 10=0.09%, 20=0.02%, 50=0.21%
  lat (msec)   : 100=0.56%, 250=1.84%, 500=6.39%, 750=9.76%, 1000=10.17%
  lat (msec)   : 2000=19.59%, >=2000=6.77%

  nvme1:

  lat (usec)   : 750=0.44%, 1000=0.41%
  lat (msec)   : 2=62.63%, 4=1.12%, 10=0.34%, 20=1.61%, 50=3.91%
  lat (msec)   : 100=2.34%, 250=5.91%, 500=8.46%, 750=4.33%, 1000=2.50%
  lat (msec)   : 2000=3.62%, >=2000=2.38%
These insights suggest the SSD designed for throughput, io2, is more suitable than the general purpose gp2 storage to meet the requirements of your logging application.
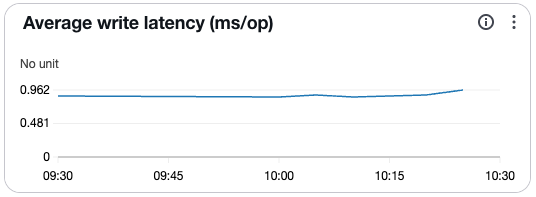
If the text output is hard to follow, you can use the fio2gnuplot package to plot the data graphically or use the visualizations available from your cloud service provider’s dashboard. See image below for an example.
The insights gathered by microbenchmarking with fio above can lead to more informed decisions about which block storage to connect to your Arm-based instance.