Optimize C++ performance with Profile-Guided Optimization and Google Benchmark
Introduction
Profile-Guided Optimization
Google Benchmark
Example operation
Using Profile Guided Optimization
Incorporating PGO into a GitHub Actions workflow
Next Steps
Optimize C++ performance with Profile-Guided Optimization and Google Benchmark
Build with PGO
To generate a binary optimized using runtime profile data, first build an instrumented binary that records usage data. Run the following command, which includes the -fprofile-generate flag, to build the instrumented binary:
g++ -O3 -std=c++17 -fprofile-generate div_bench.cpp -lbenchmark -lpthread -o div_bench.opt
Next, run the instrumented binary to generate the profile data:
./div_bench.opt
This execution creates profile data files (typically with a .gcda extension) in the same directory.
Now recompile the program using the -fprofile-use flag to apply optimizations based on the collected data:
g++ -O3 -std=c++17 -fprofile-use div_bench.cpp -lbenchmark -lpthread -o div_bench.opt
Run the optimized binary
Now run the optimized binary:
./div_bench.opt
The following output shows the performance improvement:
        Running ./div_bench.opt
Run on (4 X 2100 MHz CPU s)
CPU Caches:
  L1 Data 64 KiB (x4)
  L1 Instruction 64 KiB (x4)
  L2 Unified 1024 KiB (x4)
  L3 Unified 32768 KiB (x1)
Load Average: 0.10, 0.03, 0.01
***WARNING*** Library was built as DEBUG. Timings may be affected.
-------------------------------------------------------
Benchmark             Time             CPU   Iterations
-------------------------------------------------------
baseDiv/1500       2.86 us         2.86 us       244429
As the terminal output above shows, the average execution time is reduced from 7.90 to 2.86 microseconds. This improvement occurs because the profile data informed the compiler that the input divisor was consistently 1500 during the profiled runs, allowing it to apply specific optimizations.
Next, let’s examine how the code was optimized at the assembly level.
Inspect assembly
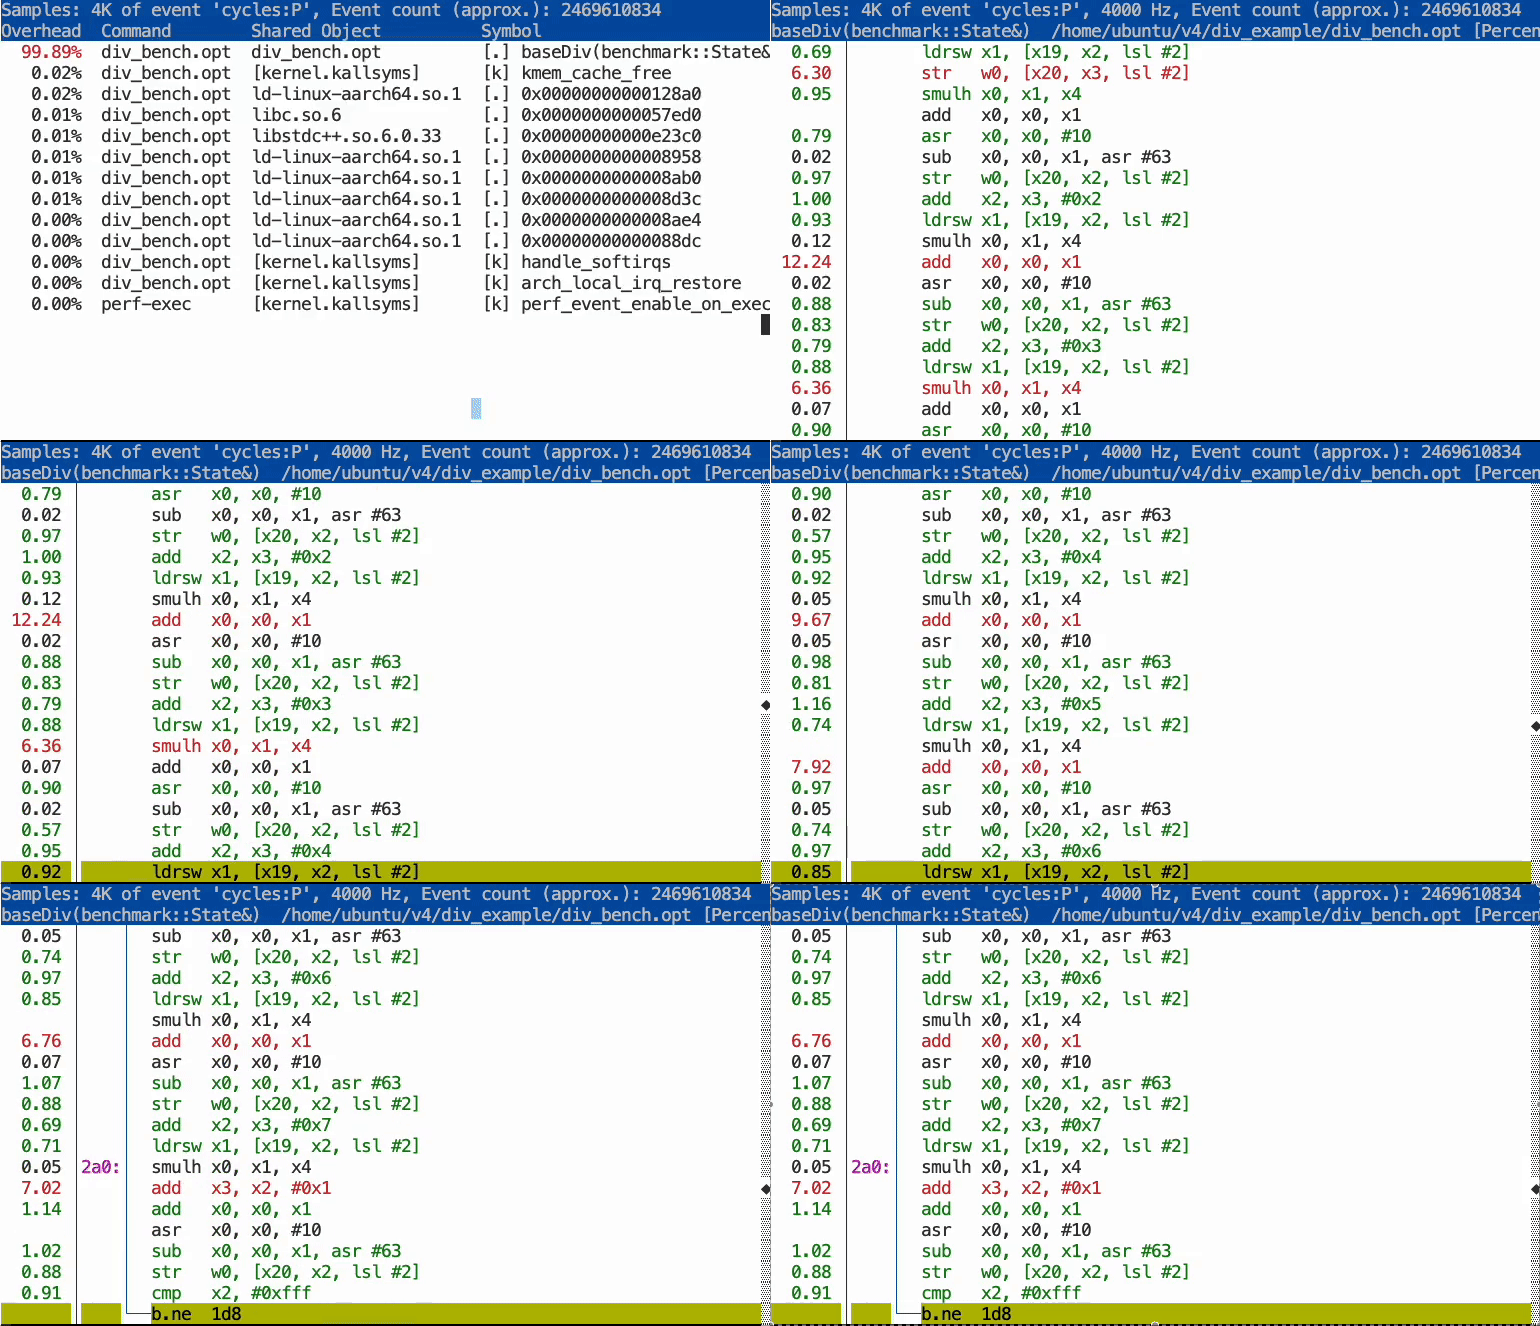
Use perf to inspect how the compiler optimized the binary:
sudo perf record -o perf-division-opt ./div_bench.opt
sudo perf report --input=perf-division-opt
As the graphic below illustrates, the profile data enabled the compiler to optimize the program significantly. The optimized code features loop unrolling and uses strength reduction (replacing the expensive division with cheaper operations), allowing the loop to execute much faster.
