Install and Use Arm integration packages for Unity
Introduction
GPU metrics
Arm Performance Studio Unity integrations
Next Steps
Install and Use Arm integration packages for Unity
View Arm GPU metrics in the Unity Profiler
Arm provides a Unity package that enables the Unity profiler to read and display the GPU hardware counters from Arm GPUs. It is supported in Unity versions 2021.2 and later.
Install the System Metrics Mali Package
Follow these steps to install the package in Unity.
In Unity, select Window > Package Manager to show the Package Manager.
In the top left corner, click the + icon and then select the option Add package by name…
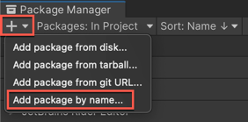 Figure 1. Add a package by name
In the search field, type com.unity.profiling.systemmetrics.mali and click Add.
When the install completes, you should then see System Metrics Mali in your list of installed packages.
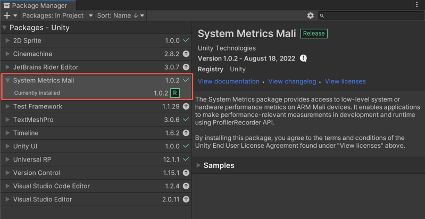 Figure 2. Mali System Metrics package in the Package Manager
Unity build settings for profiling
To use the Unity profiler to analyze performance as your game runs on a connected device, your device needs to be in developer mode and have USB debugging enabled.
- Connect your device to your computer and check that it is accessible via Android Debug Bridge (ADB). In a command terminal, enter the
adb devicescommand, which returns a list of the connected devices.
List of devices attached
RZ8MC03VVEW	device
If your device is listed as unauthorized, disable and enable the USB Debugging option on your device, and then re-approve your computer’s access.
In Unity, select File > Build Settings.
Check that Android is set as the platform. If it is not, select Android, and choose Switch Platforms.
Check that your device is visible in the Run device field. If it is not, check that the device is connected and has USB debugging enabled, then click Refresh.
Check that the following settings are enabled:
- Development Build
- Autoconnect Profiler
- Deep Profiling Support
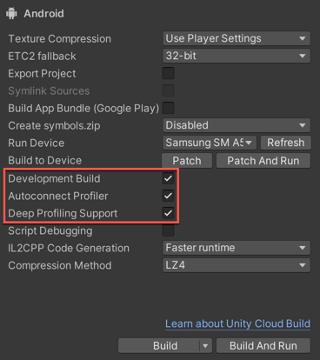 Figure 3. Unity build settings for profiling
Choose Build and Run.
Specify a location for the APK and click Save. Unity will build the game, then install and run it on the device.
Capture a profile with the Unity Profiler
Once the game is running on the device, the Unity Profiler should automatically open. If it does not, you can open it using Window > Analysis > Profiler (or the keyboard shortcut CTRL+7).
Check that the Mali System Metrics chart is visible at the bottom of the profiler modules.
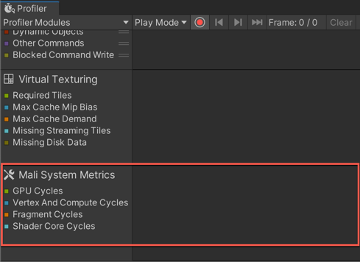 Figure 4. Unity Profiler modules
If you don’t see this chart, select Profiler Modules and enable Mali System Metrics.
Click the record button to start collecting data from the device. You’ll see the charts populating as the game runs. Play the game on the device until you get to a scene you want to analyze, perhaps where you know the frames per second (FPS) drops or the game slows down. When you’ve finished, click the button again to stop recording.
The Mali System Metrics chart displays a high-level overview of how the GPU distributed its processing load:
GPU Cycles - Indicates the overall GPU processing load requested by the application. The counter increments every clock cycle that the GPU has any pending workload active, queued or stalled.
Vertex and Compute Cycles - The number of cycles where the GPU was busy computing one of the following: vertex shaders, tessellation shaders, geometry shaders, fixed function tiling, or compute shaders.
Fragment Cycles - The number of cycles where the GPU calculates any type of fragment shader operation. This counter increments every clock cycle where the GPU has any workload present in the fragment queue. For most content there are orders of magnitude more fragments than vertices, so this counter will usually be the highest processing load.
Shader Core Cycles – The number of cycles where the shader core is processing any workload. Workloads could be arithmetic, texture, or load/store operations.
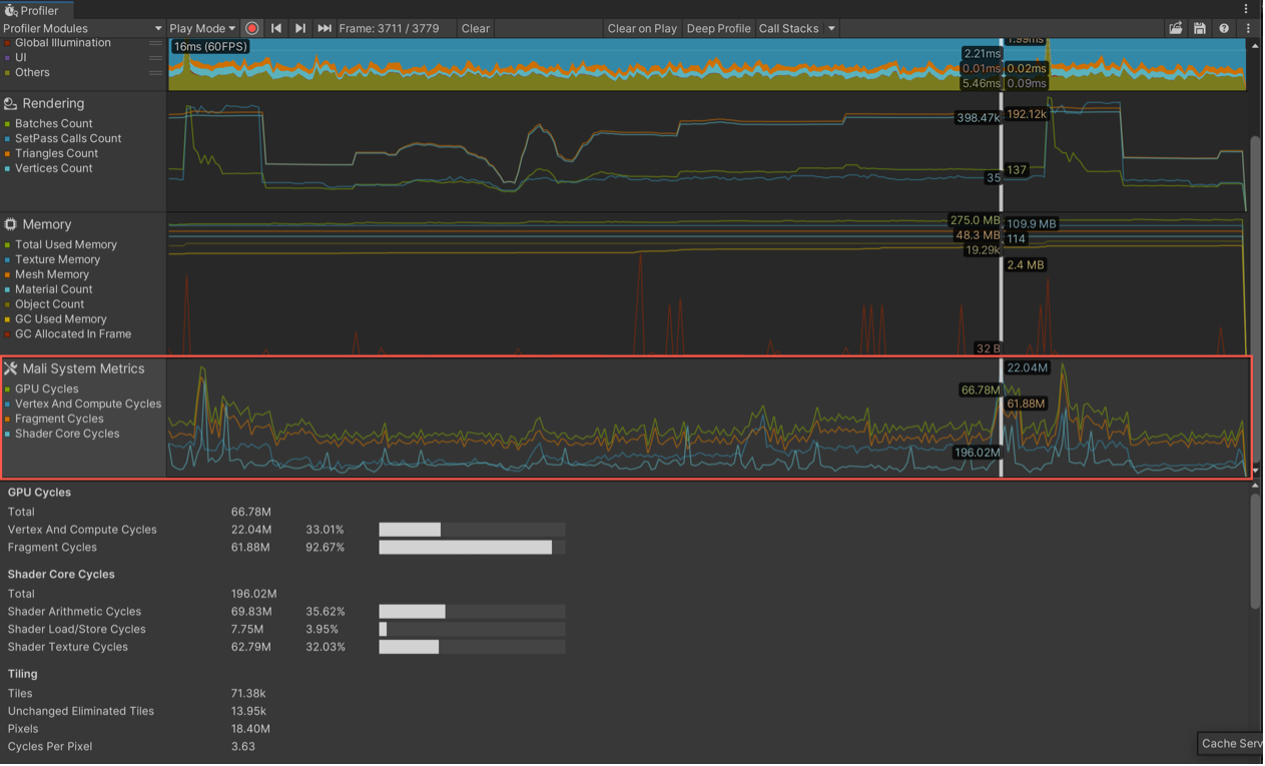 Figure 5. Mali System Metrics in the Unity Profiler
Select the chart to see more detailed metrics for the currently selected frame. For descriptions of each metric, hover over the name to see a tooltip or refer to Unity’s Metrics Guide .
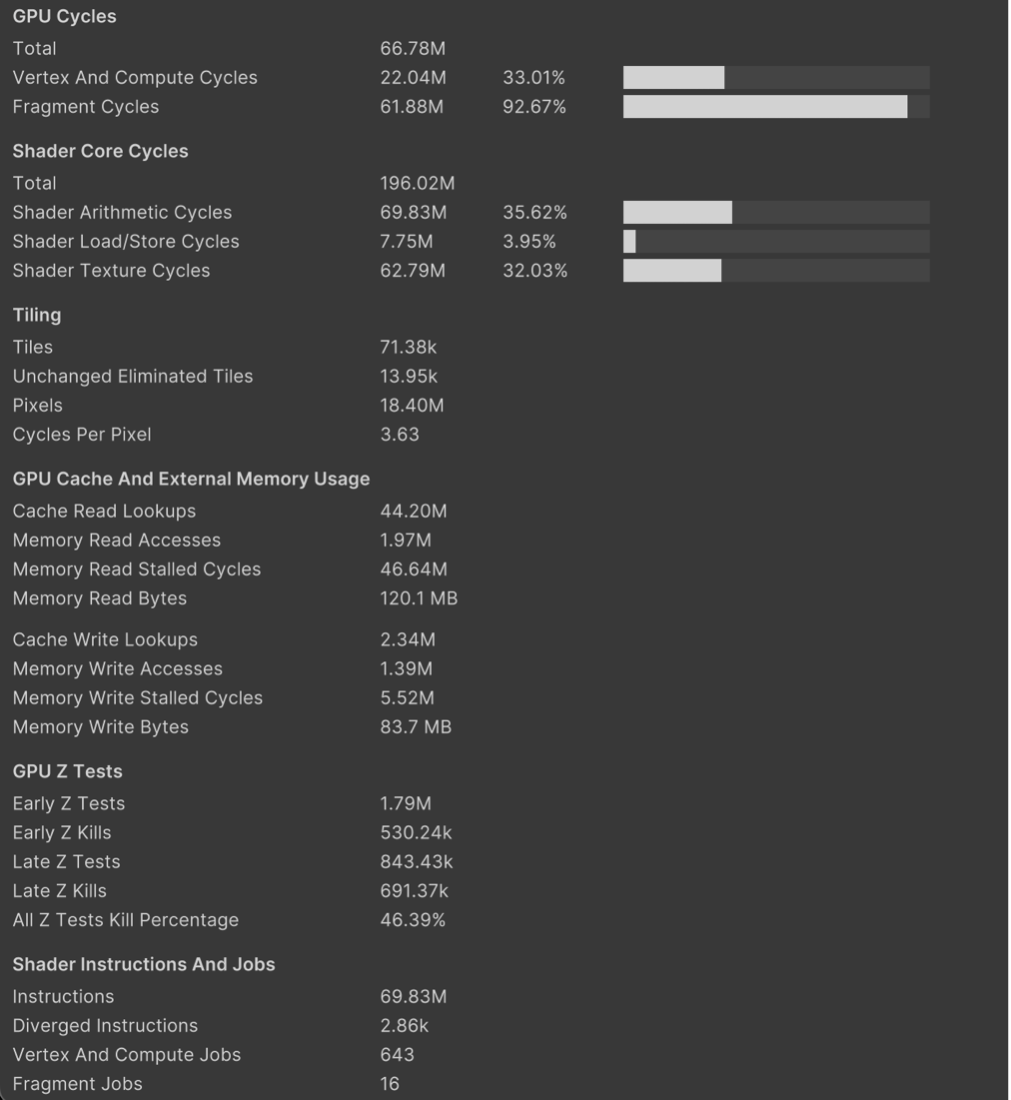 Figure 6. Detailed GPU Metrics in the Unity Profiler