Optimize graphics performance using Frame Advisor render graphs
Introduction
What are render graphs?
Generating a render graph for your application
Understanding your render graph
Problem solving – unused resources
Problem solving – unwanted execution nodes
Problem solving – textures with excessive resolution
Problem solving – inefficient transfer workloads
Next Steps
Optimize graphics performance using Frame Advisor render graphs
Problem
Some textures used in your application may be unnecessarily large.
Frame Advisor provides an easy way to detect this situation. It shows the resolution of the image being rendered in each execution node.
There is an example of this in the render graph you looked at in a previous section:
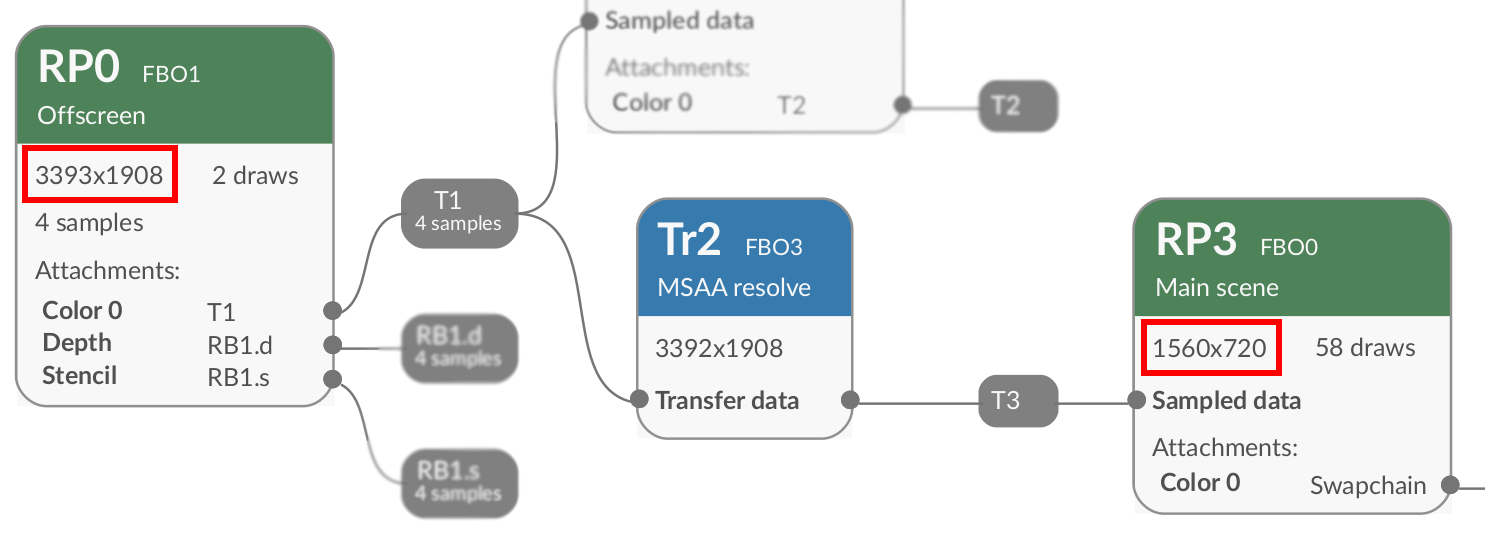 Textures with excessive resolution
This graph shows three execution nodes, through which data flows from left to right. These are:
- Render Pass 0 (
RP0) - Transfer node 2 (
Tr2), discussed in the next section - Render Pass 3 (
RP3)
The resolution given in the top left-hand corner of the execution nodes reduces from 3393×1908 (RP0) to 1560×720 (RP3). The pixels discarded at each step represent wasted bandwidth and power.
Solution
Make the computation shown in the graph produce the smaller final texture from smaller input textures. In this example, reduce the resolution of the inputs to Render Pass 0 (RP0).