Profile ONNX model performance with SME2 using KleidiAI and ONNX Runtime
Introduction
ONNX Runtime architecture with SME2 acceleration
Integration of KleidiAI to ORT MLAS
Build ONNX Runtime with KleidiAI and SME2 for Android
Profile ONNX model performance
Next Steps
Profile ONNX model performance with SME2 using KleidiAI and ONNX Runtime
Profile ONNX model performance using ResNet-50 v2
Resnet50v2 serves as the example model in this Learning Path. Download the model package containing the ONNX model and its input data from the ONNX model repository , then transfer it to your Android device:
wget https://github.com/onnx/models/raw/refs/heads/main/validated/vision/classification/resnet/model/resnet50-v2-7.tar.gz -O resnet50-v2-7.tar.gz
adb push resnet50-v2-7.tar.gz /data/local/tmp/
adb shell tar xfz /data/local/tmp/resnet50-v2-7.tar.gz -C /data/local/tmp/
The Android device used in this example is a VIVO X300 phone with MTK D9500 processor, which has Arm C1-Ultra, C1-Premium, and C1-Pro CPU cores with SME2 support. A C1-Pro CPU core running at 2.0GHz was selected to run the onnxruntime_perf_test benchmark application. You can use any Android device with SME2 support.
To compare the performance of running Resnet50v2 on ORT with and without SME2 support, build two versions of ORT: one with SME2 support (set onnxruntime_USE_KLEIDIAI=ON when building ORT), and another without SME2 support (onnxruntime_USE_KLEIDIAI=OFF when building ORT).
Run the benchmark on the device, pinning execution to a single C1-Pro core:
adb shell "taskset 1 /data/local/tmp/onnxruntime_perf_test -e cpu -r 5 -m times -s -Z -x 1 /data/local/tmp/resnet50-v2-7/resnet50-v2-7.onnx -p /data/local/tmp/resnet50v2.onnx_1xC1-Pro_profile"
The taskset 1 command sets the CPU affinity of onnxruntime_perf_test to CPU core 0, which is a C1-Pro CPU core. The -x 1 flag sets the number of threads used to parallelize execution within nodes to 1 (single thread).
Here is the output from running onnxruntime_perf_test with ORT with SME2 support:
        Setting intra_op_num_threads to 1
Disabling intra-op thread spinning between runs
Session creation time cost: 0.217932 s
First inference time cost: 196 ms
Total inference time cost: 0.49481 s
Total inference requests: 5
Average inference time cost total: 98.961997 ms
Total inference run time: 0.494854 s
Number of inferences per second: 10.104
Avg CPU usage: 11 %
Peak working set size: 271122432 bytes
Avg CPU usage:11
Peak working set size:271122432
Runs:5
Min Latency: 0.0958204 s
Max Latency: 0.101519 s
P50 Latency: 0.0995086 s
P90 Latency: 0.101519 s
P95 Latency: 0.101519 s
P99 Latency: 0.101519 s
P999 Latency: 0.101519 s
Here is the output from running onnxruntime_perf_test with ORT without SME2 support:
        Setting intra_op_num_threads to 1
Disabling intra-op thread spinning between runs
Session creation time cost: 0.227282 s
First inference time cost: 343 ms
Total inference time cost: 1.69691 s
Total inference requests: 5
Average inference time cost total: 339.381120 ms
Total inference run time: 1.69697 s
Number of inferences per second: 2.94642
Avg CPU usage: 11 %
Peak working set size: 241426432 bytes
Avg CPU usage:11
Peak working set size:241426432
Runs:5
Min Latency: 0.333323 s
Max Latency: 0.34682 s
P50 Latency: 0.336476 s
P90 Latency: 0.34682 s
P95 Latency: 0.34682 s
P99 Latency: 0.34682 s
P999 Latency: 0.34682 s
Performance analysis
Visualize profiling data with Perfetto
You can use Perfetto to view the two JSON profile files.
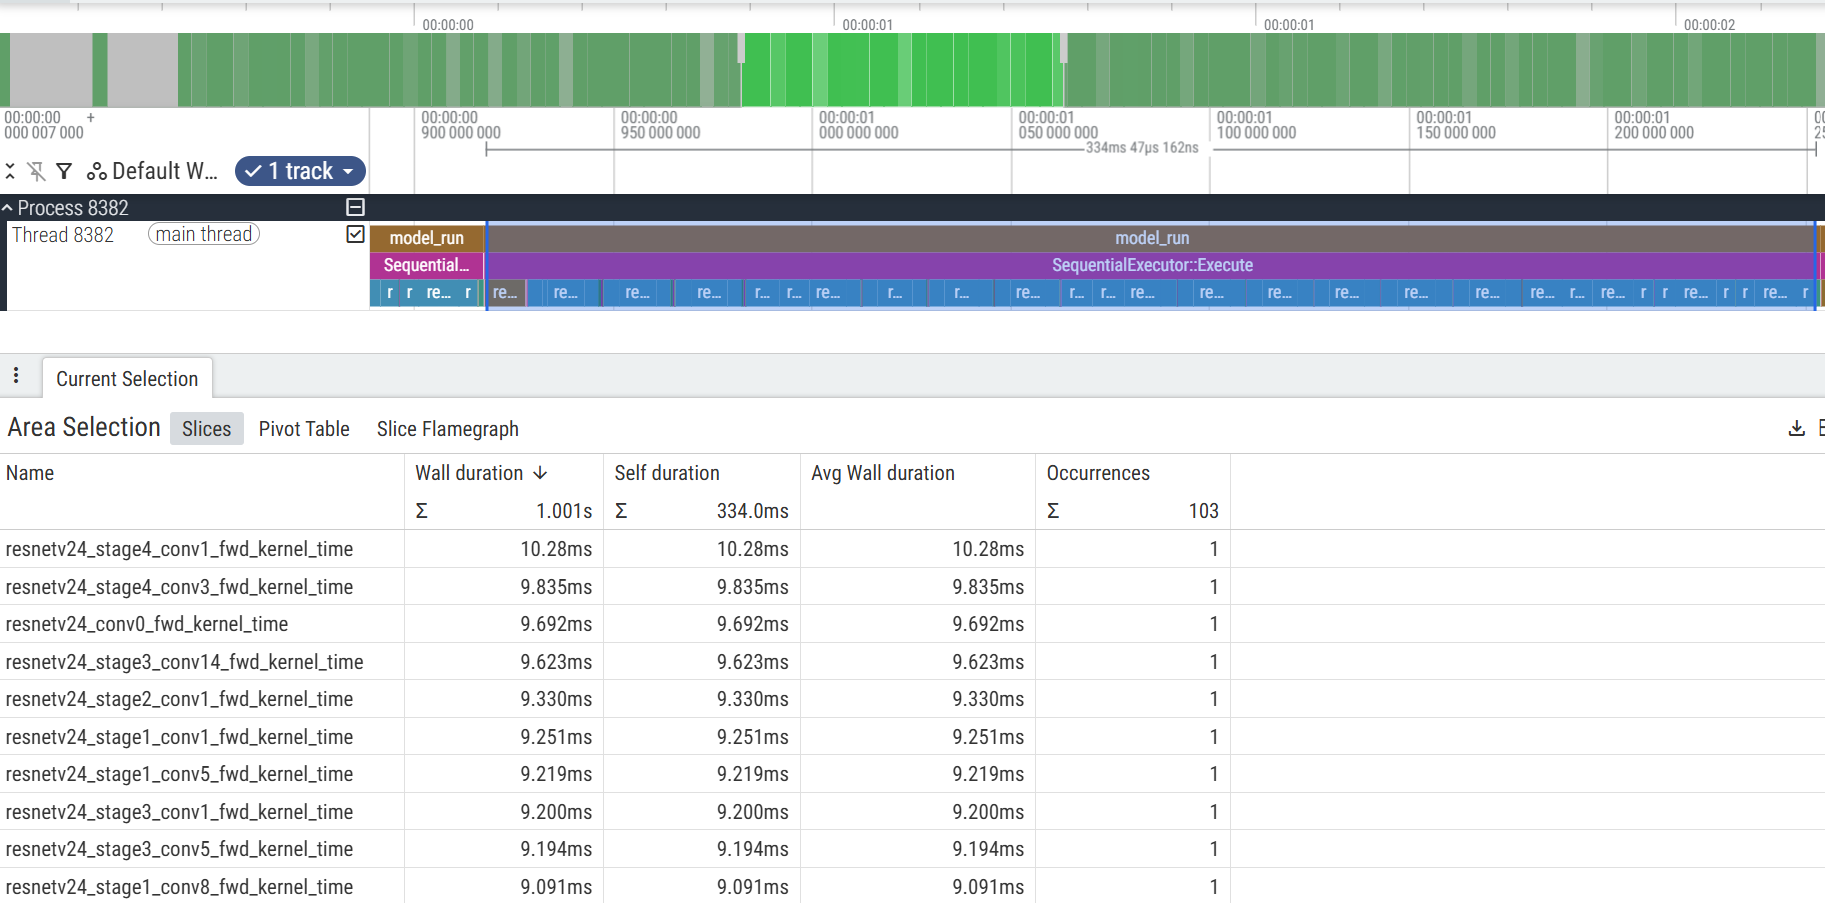
The figure below is a screenshot of the Non-KleidiAI version of the JSON profile file. The selected part (one model_run/SequentialExecutor) in the figure includes information of one inference execution.
 Perfetto view of Non-KleidiAI version of ORT
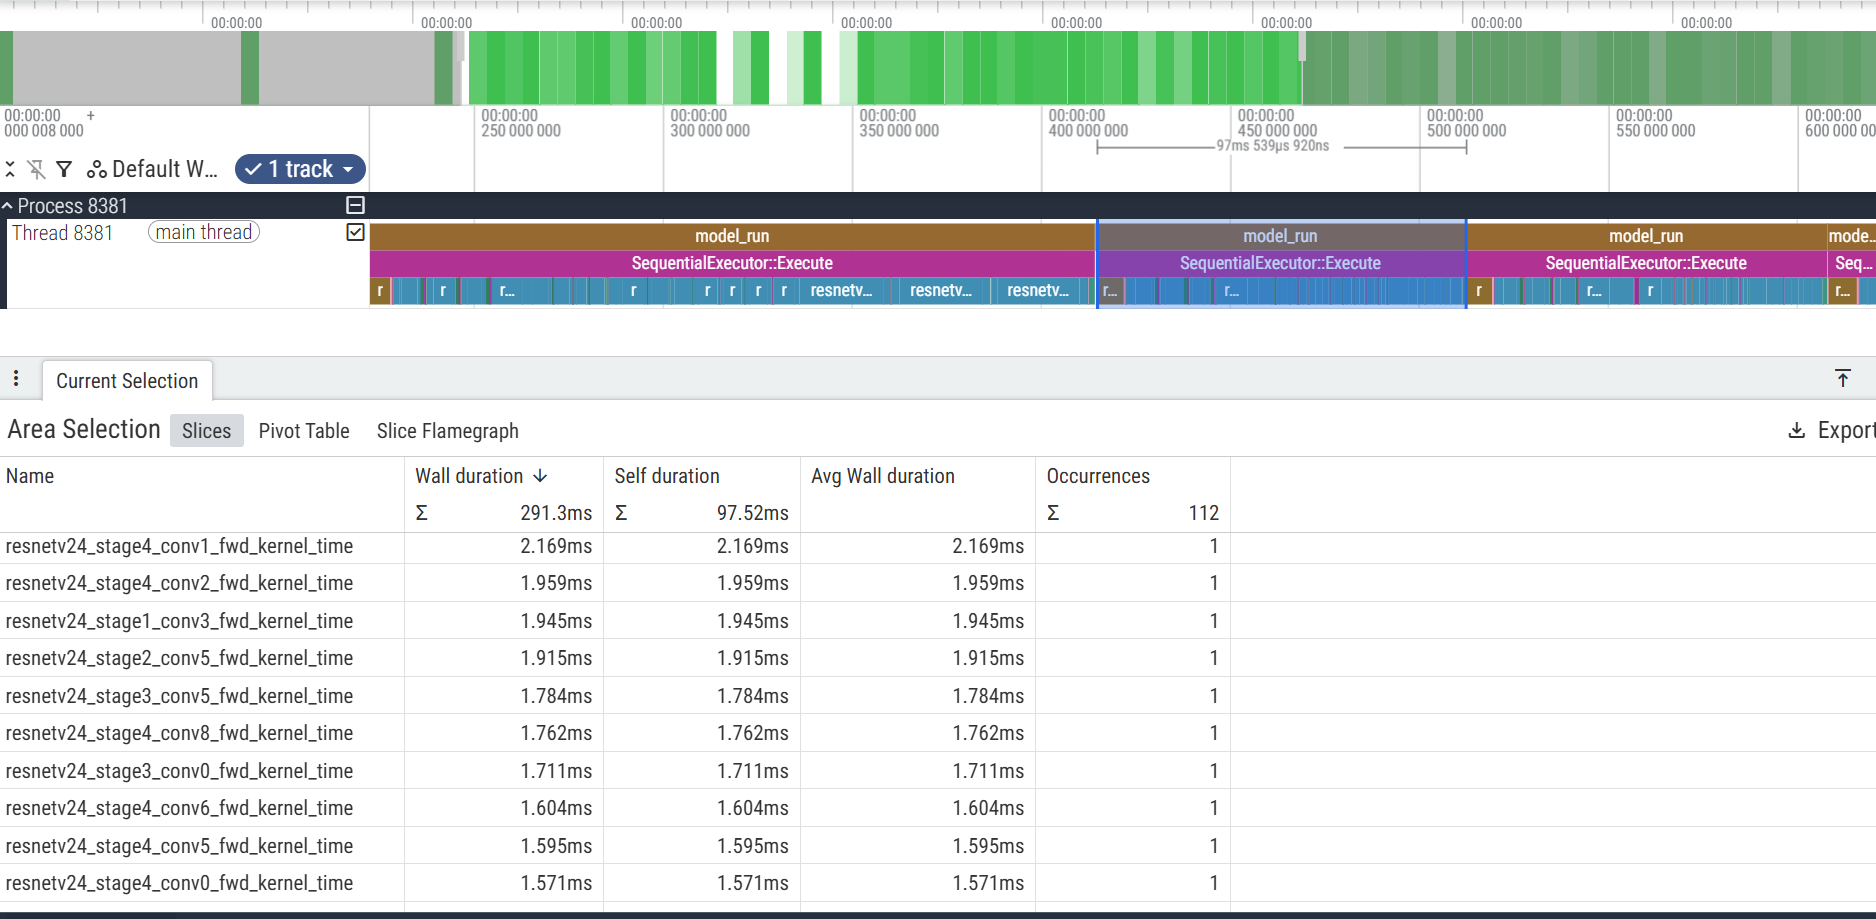
The figure below is a screenshot of the KleidiAI (with SME2) version of the JSON profile file. The selected part (one model_run/SequentialExecutor) in the figure includes information of one inference execution.
 Perfetto view of KleidiAI with SME2 version of ORT
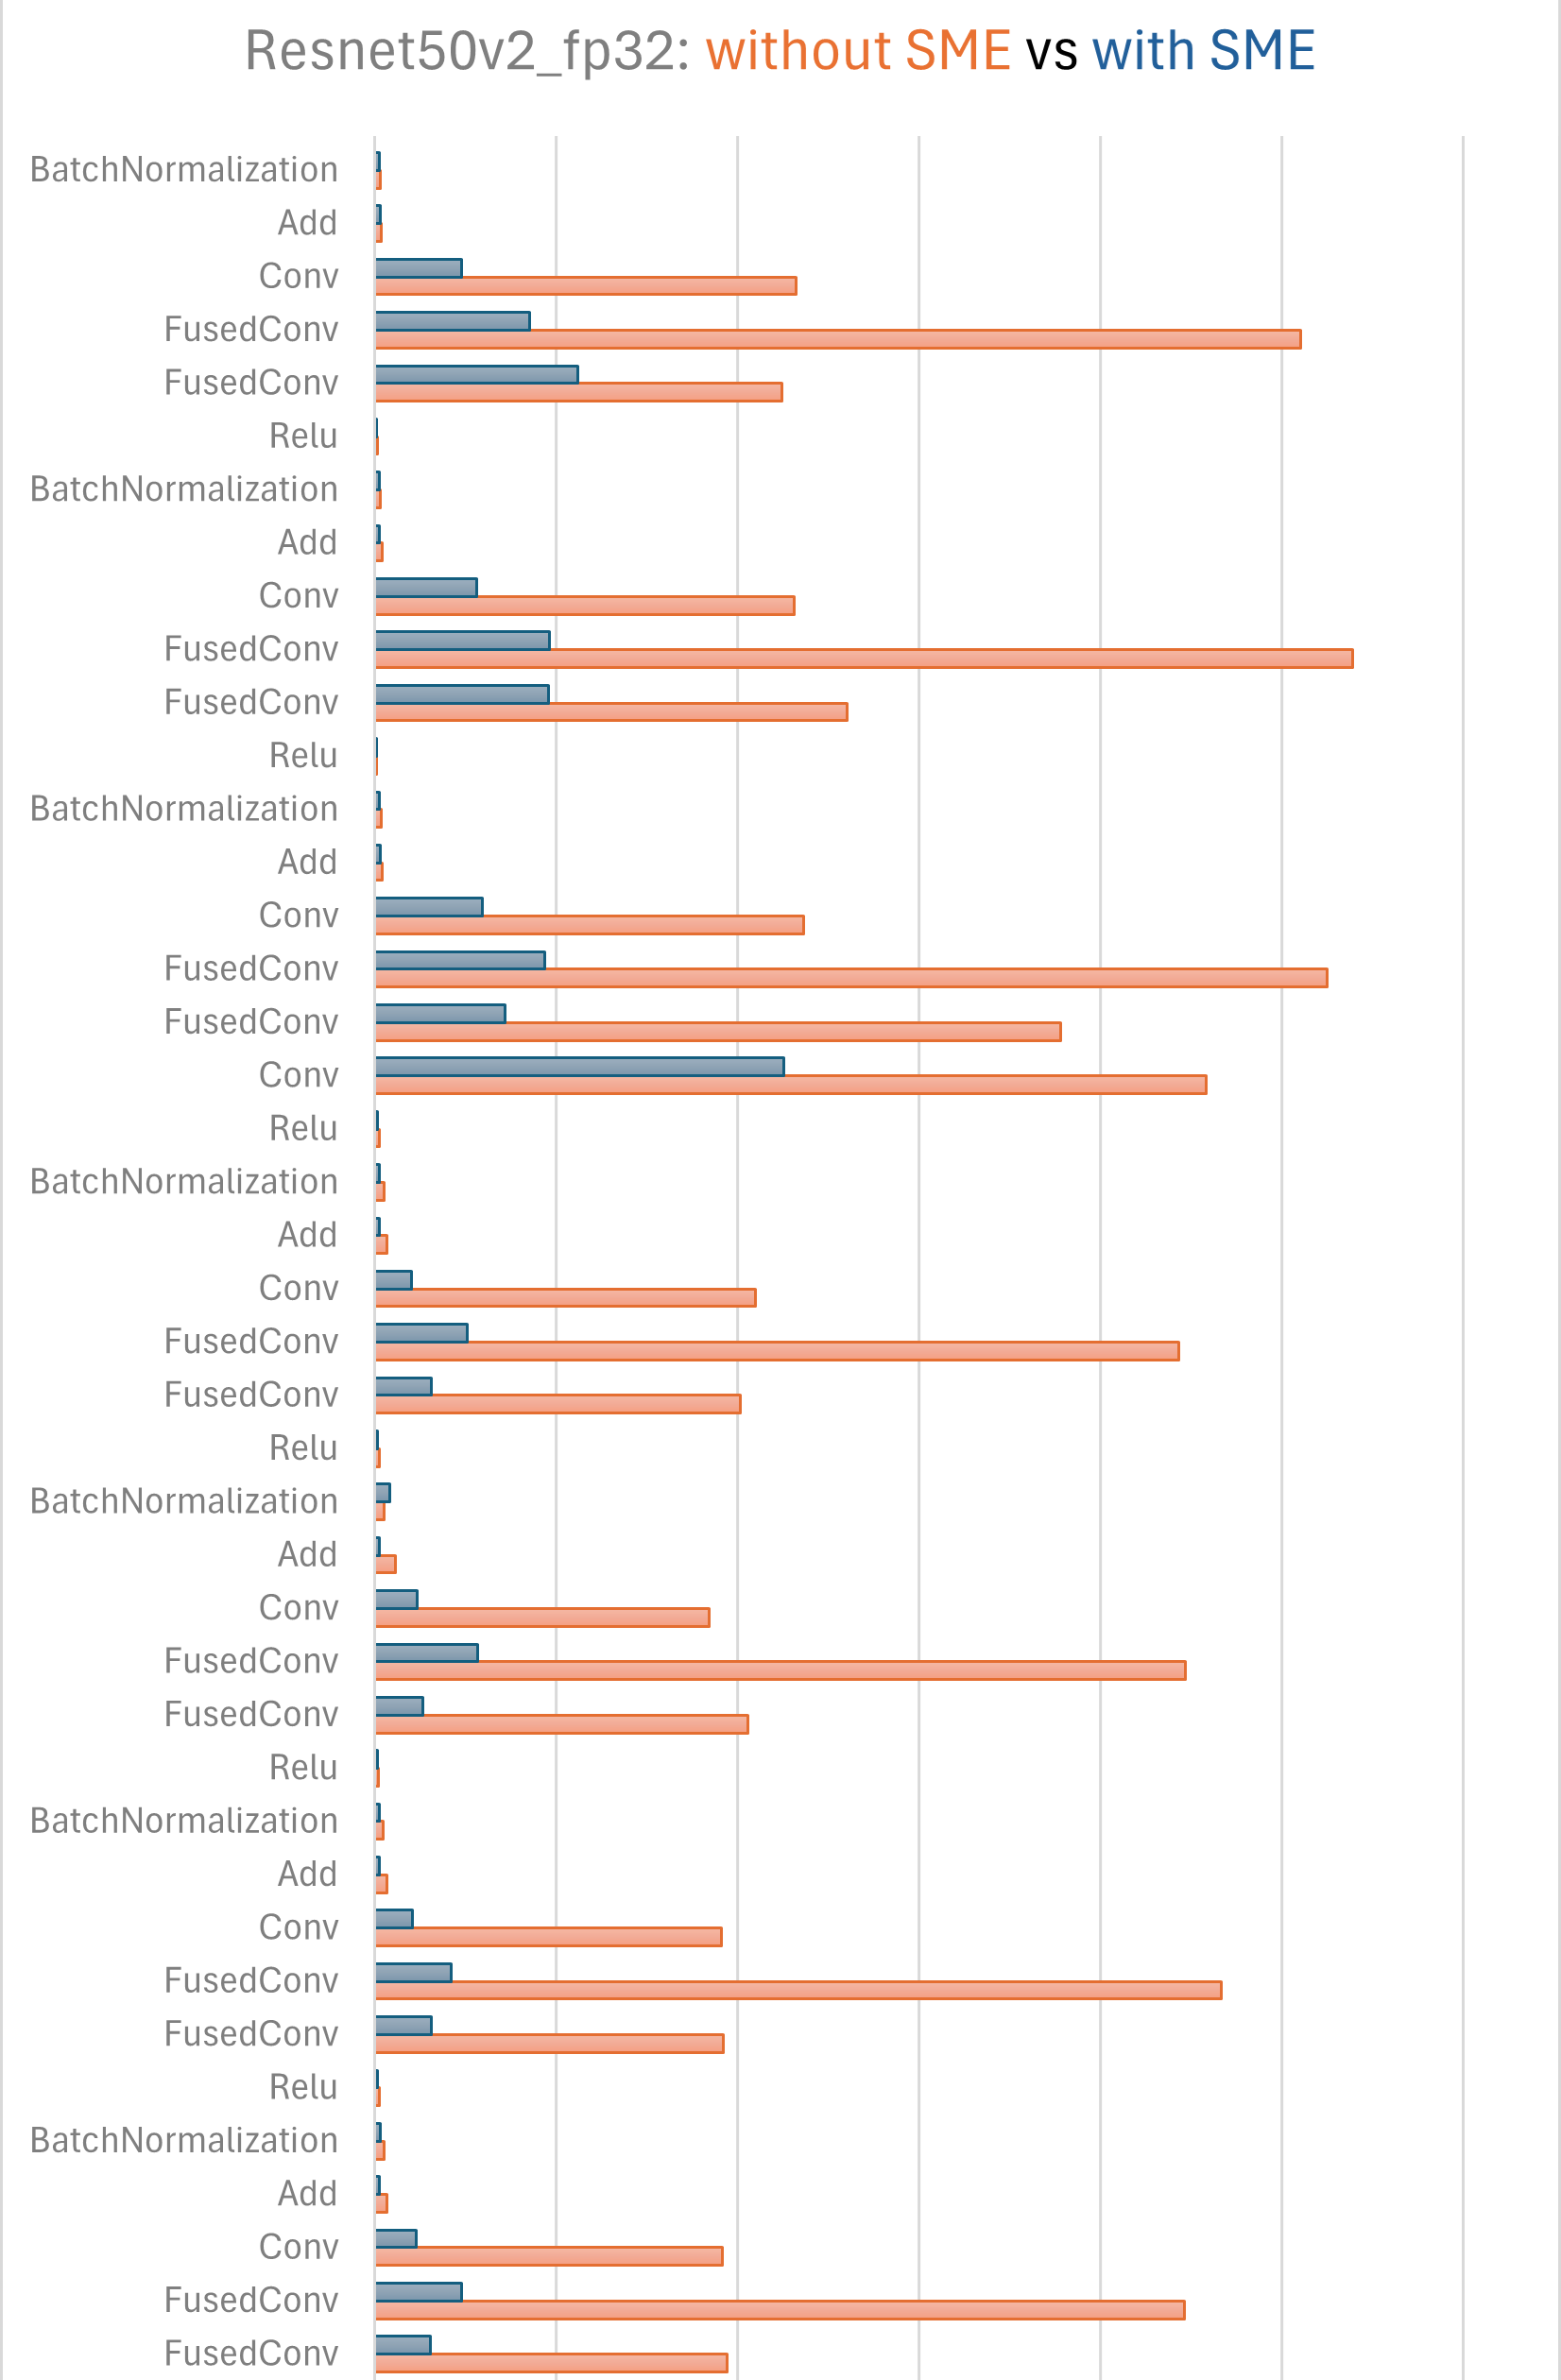
You can also convert the two JSON profile files to CSV sheets with an external Python script and combine the individual operator execution times of the Non-KleidiAI and KleidiAI (with SME2) versions into a single chart.
 Operator execution time comparison
It shows that ORT with KleidiAI (with SME2) kernels uplifts the performance significantly, especially for convolution operators.
Analyze performance with Arm Streamline
Arm Streamline is a graphical performance analysis tool that transforms sampling data, instruction trace, and system trace into reports presenting the data in both visual and statistical forms. It uses hardware performance counters with kernel metrics to provide an accurate representation of system resources. You can learn more about Arm Streamline on developer.arm.com and install it with the Streamline Install Guide . This section shows what this performance analysis looks like with Arm Streamline but doesn’t dive into the details of actually using the tool.
In the timeline view of Streamline, you can see SME2 floating point Outer Product and Accumulate (MOPA) instructions used intensively during inference:
 SME2 instructions and cycles shown in Streamline
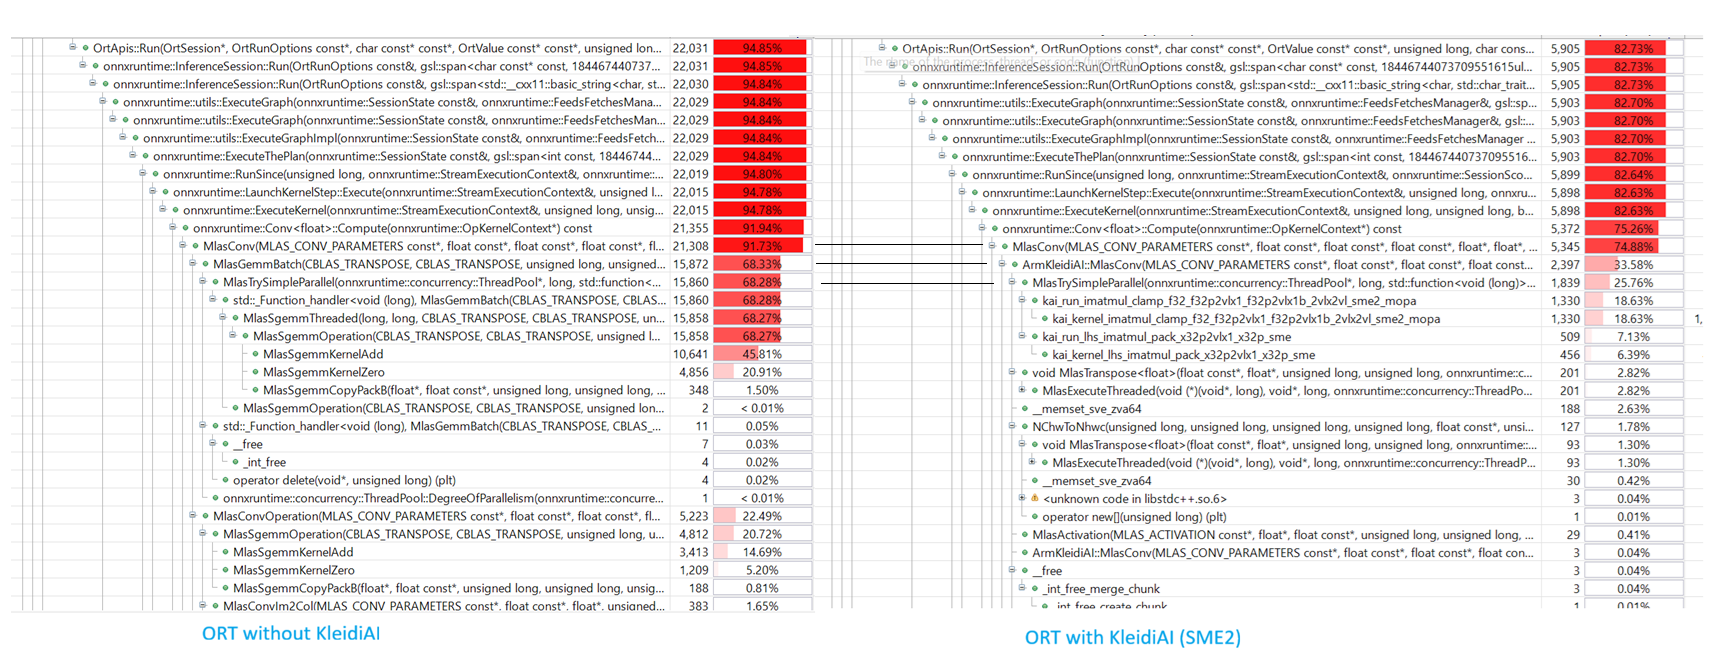
You can combine (with an external script) the function call views of ORT without and with KleidiAI (with SME2) into a single figure:
 Function call percentage of both versions of ORT in Streamline
It shows that KleidiAI kernels provide a significant performance uplift for convolution operators compared to the default MLAS kernels (MlasSgemmKernelAdd and MlasSgemmKernelZero).
What you’ve accomplished and what’s next
You’ve successfully profiled Resnet50v2 on Android with and without KleidiAI SME2 optimizations. You measured a 3.4x performance improvement (from 339ms to 99ms average inference time) when enabling SME2 kernels. You explored profiling tools including perfetto for operator-level analysis and Arm Streamline for hardware counter insights. The results clearly demonstrate that KleidiAI kernels dramatically accelerate convolution operators compared to standard MLAS implementations.
By enabling KleidiAI (SME2) in ONNX Runtime, you unlock the parallel processing power of Arm SME2, transforming the Arm CPU from a fallback option into a high-performance AI engine capable of running LLMs and complex vision models efficiently on device. You can now apply these techniques to profile and optimize your own ONNX models on Arm platforms with SME2 support.