Enable Neural Frame Rate Upscaling in Unreal Engine
Introduction
Understand neural graphics and NFRU
Set up the development environment
Set up the Unreal project with NFRU enabled
Validate NFRU in Unreal Engine
Understand console variables for NFRU
Set up a debug view in Unreal Engine
Use RenderDoc for Arm GPUs with NFRU for debugging and analysis
Next Steps
Enable Neural Frame Rate Upscaling in Unreal Engine
Introduction
Understand neural graphics and NFRU
Set up the development environment
Set up the Unreal project with NFRU enabled
Validate NFRU in Unreal Engine
Understand console variables for NFRU
Set up a debug view in Unreal Engine
Use RenderDoc for Arm GPUs with NFRU for debugging and analysis
Next Steps
Why use RenderDoc for Arm GPUs with NFRU
When you integrate NFRU into your game, you need visual debugging and performance profiling. RenderDoc is a frame capture and analysis tool that you can use to review frames, Vulkan API calls, shader inputs and outputs, and GPU resource states.
Arm provides additional features for RenderDoc in RenderDoc for Arm GPUs .
Use RenderDoc for Arm GPUs to:
- Investigate unexpected visual output or step through the rendering process
- Analyze the sequence of Vulkan API calls your engine makes
- Inspect memory usage or GPU resource states
- Validate your data graph pipeline or identify synchronization issues
Install Arm Performance Studio
Download Arm Performance Studio from the
Arm Performance Studio Downloads
page. For NFRU, use version 2025.6 or later.
For setup instructions, see the Arm Performance Studio install guide .
After installation, you’ll find RenderDoc for Arm GPUs in the Windows Start menu.
Prepare a Windows non-editor build
NFRU does not run in Development Editor, DebugGame Editor, or Debug Editor. Use the editor only to cook content, and prepare the same non-editor build you used to validate NFRU:
- Start the project using Development Editor.
- Select Platforms > Windows > Cook Content and wait for cooking to finish.
- Close Unreal Editor.
- In Visual Studio 2022, compile a Development, DebugGame, or Debug non-editor build for Win64.
- Locate the exported
.exeunder<project-root>\Binaries\Win64.
If you changed only C++ code after the last cook, recompile without recooking. If you changed shaders or assets, cook the content again before profiling.
Launch the Windows executable from RenderDoc
To profile your build:
- Open RenderDoc for Arm GPUs.
- Select Launch Application.
- Enter the full path to the non-editor
.exein the Executable Path field. - (Optional) Add command-line arguments in the Command-line Arguments field.
- Set the Working Directory to your packaged build folder if needed.
- Select Launch.
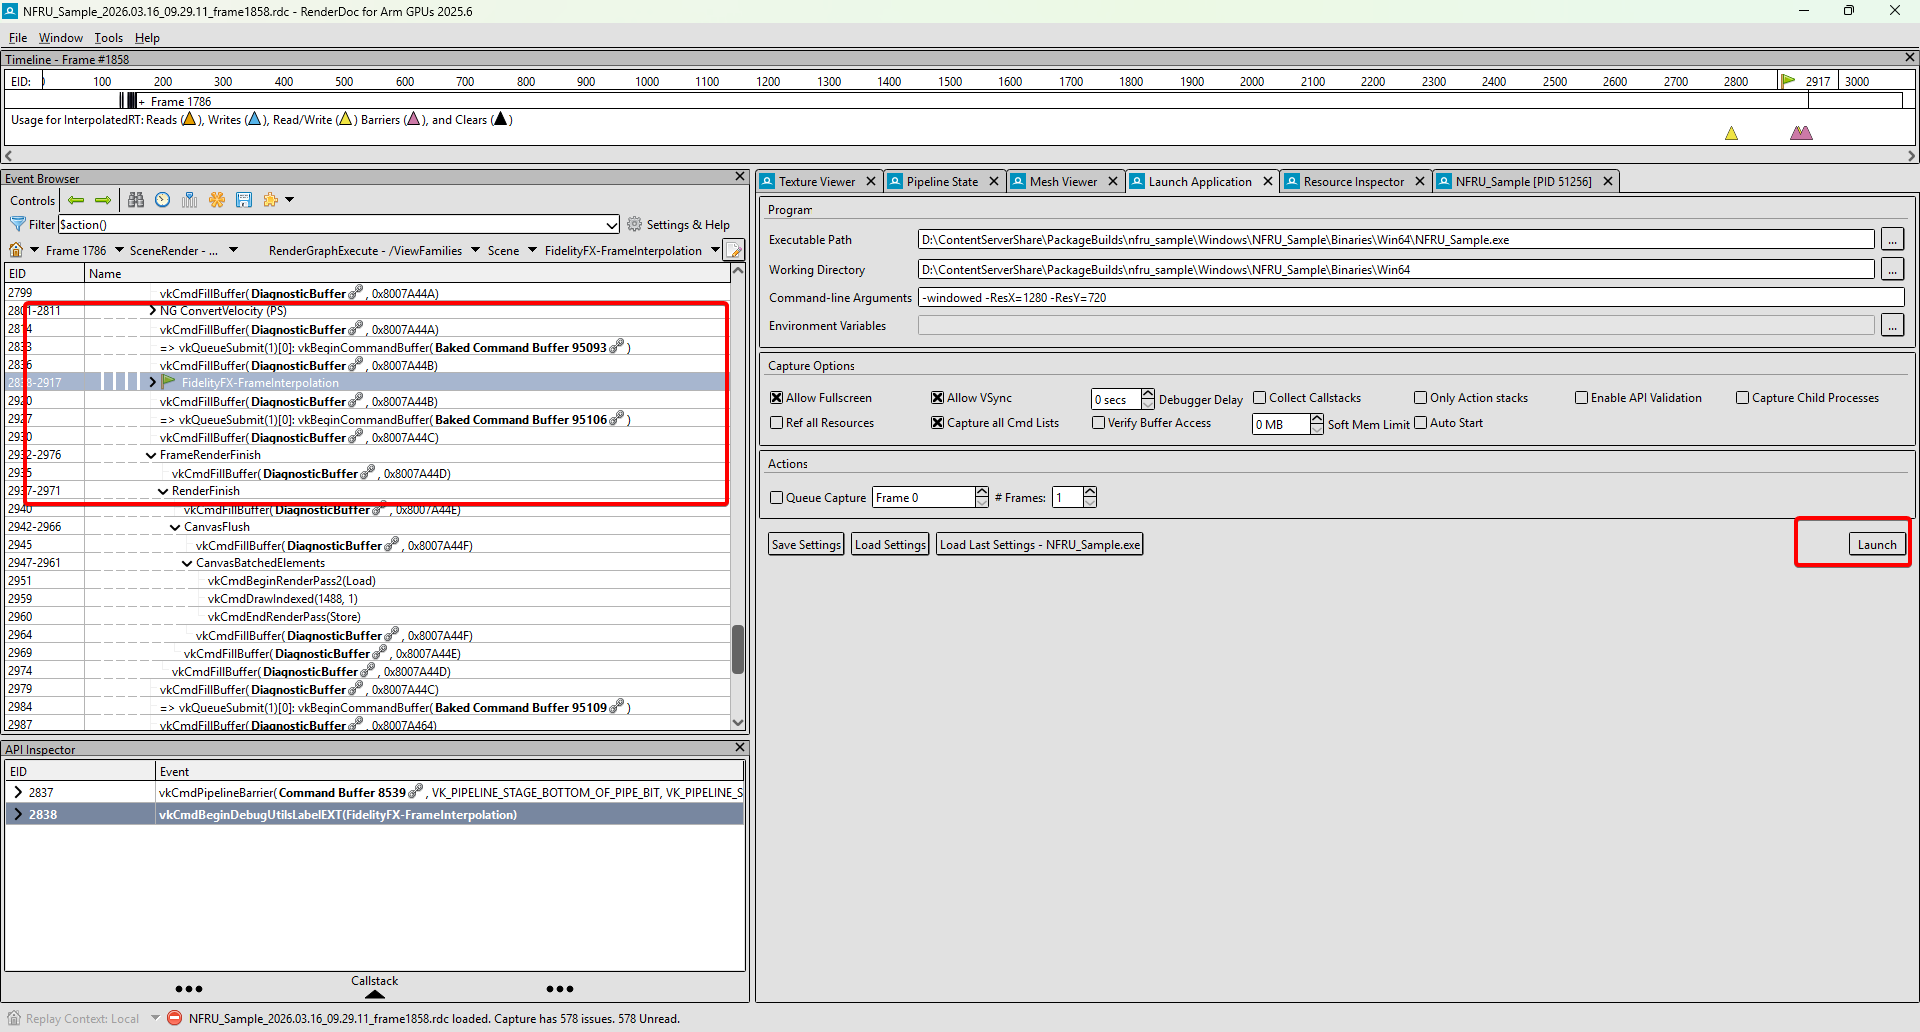 Launch the packaged NFRU application from RenderDoc
Your application launches under RenderDoc. You can now capture frames and analyze GPU activity.
Before you capture a frame, enter stat FrameGen in the application console to confirm that NFRU is generating and pacing frames. Keep Vulkan Configurator running with the required Graph and Tensor emulation layers active while you profile.
Capture a frame in RenderDoc
To capture a frame:
- With your application running, return to the RenderDoc window.
- Select the Capture Frame Immediately button (camera icon) or press
F12while your game window is focused.
The captured frame appears in RenderDoc.
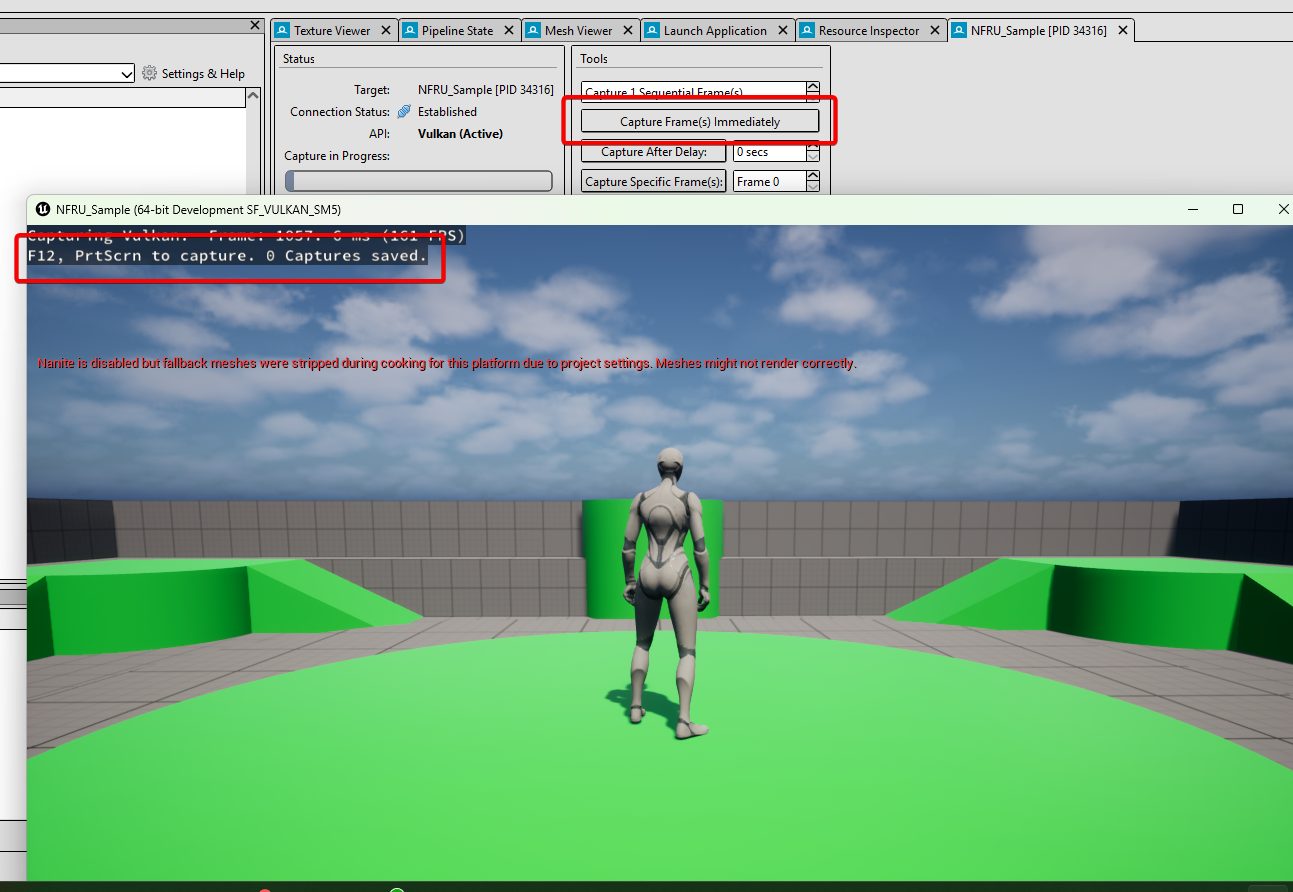 Capture a frame from the running NFRU application
You can now analyze the rendering pipeline, inspect Vulkan API calls, and debug visual output at each stage.
Analyze the event list
After capturing a frame, use the RenderDoc event browser to review the sequence of Vulkan API calls and draw events. Select individual events to inspect their details, view associated resources, and debug specific pipeline stages.
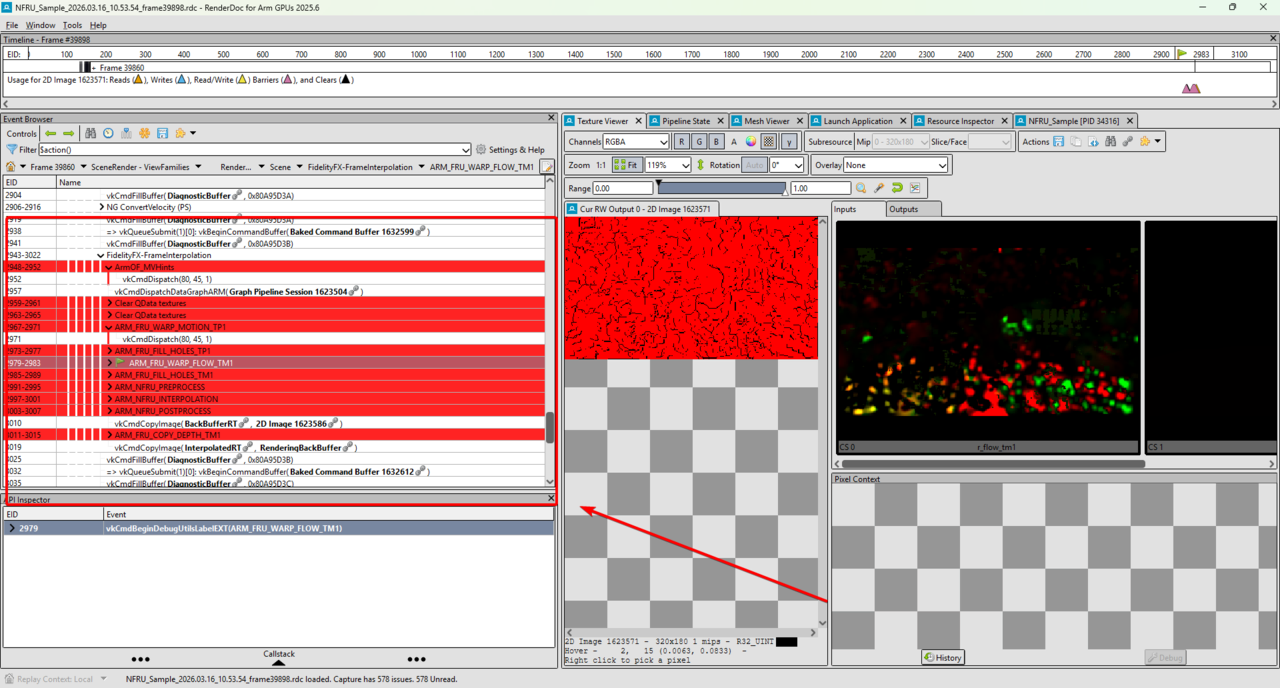 Inspect NFRU rendering events in RenderDoc
With RenderDoc, you can:
- Step through draw calls and dispatches
- Inspect bound resources, descriptor sets, and shaders
- Explore your data graph pipeline execution frame by frame
For more information, see the Debug With RenderDoc User Guide .
What you’ve accomplished
You’ve now learned how to set up and use RenderDoc for Arm GPUs to debug your game. You’ve completed a full workflow for NFRU in Unreal Engine.
You can integrate neural frame generation into Unreal Engine, optimize it for your hardware using console variables, and debug your rendering pipeline.