Enable Neural Frame Rate Upscaling in Unreal Engine
Introduction
Understand neural graphics and NFRU
Set up the development environment
Set up the Unreal project with NFRU enabled
Validate NFRU in Unreal Engine
Understand console variables for NFRU
Set up a debug view in Unreal Engine
Use RenderDoc for Arm GPUs with NFRU for debugging and analysis
Next Steps
Enable Neural Frame Rate Upscaling in Unreal Engine
Introduction
Understand neural graphics and NFRU
Set up the development environment
Set up the Unreal project with NFRU enabled
Validate NFRU in Unreal Engine
Understand console variables for NFRU
Set up a debug view in Unreal Engine
Use RenderDoc for Arm GPUs with NFRU for debugging and analysis
Next Steps
Enable the debug view
To inspect intermediate buffers during frame generation, enter this command in the console of the running Windows non-editor executable:
r.NFRU.ShowDebugView 1
The debug view activates a grid that shows you depth, disocclusion, and warped color buffers. If the grid appears and updates during gameplay, it also verifies that the NFRU path is active. The command does not verify NFRU in Development Editor, DebugGame Editor, or Debug Editor because NFRU does not run in those builds.
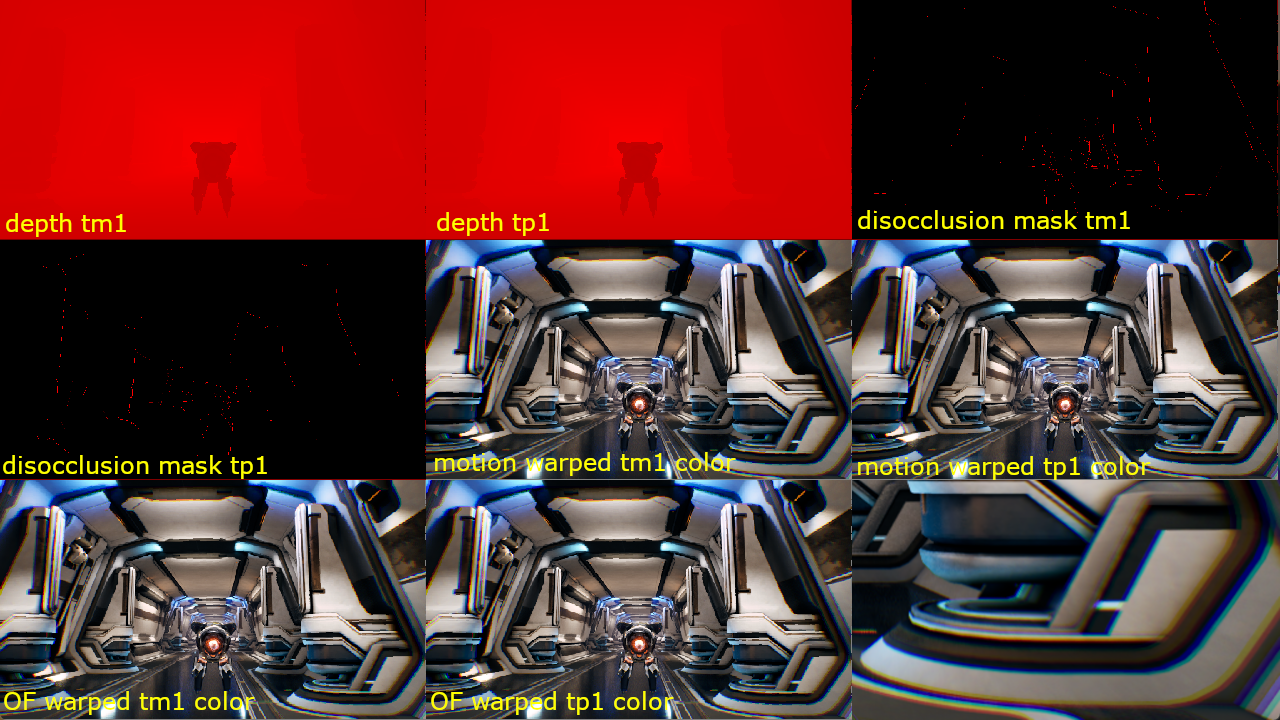 Debug view grid for frame generation debugging
Understand the debug grid
The frame generation system displays a 3 × 3 grid of intermediate data. You can use this grid to validate motion estimation, identify disocclusion regions, and verify warping results.
Two time references appear in the grid:
tm1– previous frametp1– next frame
Grid layout
The layout of the 3 × 3 grid is as follows:
| Row | Column 1 | Column 2 | Column 3 |
|---|---|---|---|
| 1 | depth tm1 | depth tp1 | disocclusion mask tm1 |
| 2 | disocclusion mask tp1 | motion warped tm1 color | motion warped tp1 color |
| 3 | optical flow warped tm1 color | optical flow warped tp1 color | — |
What each tile shows
Depth tiles show the depth buffers for the previous and next frames. Use these tiles to identify geometry and disocclusion regions.
Disocclusion mask tiles highlight pixels that become visible as the camera moves. These areas often require special handling during frame generation.
Motion-warped color tiles display frames reprojected using engine motion vectors. Check these tiles to verify motion-vector accuracy.
Optical flow warped color tiles show frames warped with optical flow estimation. Compare these with the motion-warped tiles to assess optical flow quality.
Use the debug view to troubleshoot
You can use the debug view to identify the following issues during development:
- Spot incorrect motion vectors
- Detect disocclusion artifacts
- Compare motion-vector and optical-flow warping results
- Diagnose frame interpolation problems
Run stat FrameGen at the same time when you need to correlate a visual issue with generated-frame or frame-pacing statistics.
What you’ve accomplished and what’s next
You’ve now activated the NFRU debug view grid in Unreal Engine and learned how to read it. You can inspect intermediate buffers to validate frame generation and identify common issues.
Next, you’ll use RenderDoc to capture and analyze frame data in greater detail.