Analyze Neural Frame Rate Upscaling using Project Moku
Introduction
Understand Project Moku as an NFRU test environment
Enable the Arm Neural Graphics plugin
Validate NFRU with Streamline and RenderDoc
Analyze occlusion with NFRU and Project Moku
Analyze particle effects with NFRU and Project Moku
Analyze lighting changes with NFRU and Project Moku
Analyze and adjust NFRU frame pacing
Next Steps
Analyze Neural Frame Rate Upscaling using Project Moku
Introduction
Understand Project Moku as an NFRU test environment
Enable the Arm Neural Graphics plugin
Validate NFRU with Streamline and RenderDoc
Analyze occlusion with NFRU and Project Moku
Analyze particle effects with NFRU and Project Moku
Analyze lighting changes with NFRU and Project Moku
Analyze and adjust NFRU frame pacing
Next Steps
Set up the validation workflow
NFRU reconstructs an intermediate frame between two rendered frames to make motion feel smoother without requiring the engine to render another full frame. In the Project Moku captures, the generated output remains coherent across representative gameplay. The most visible differences are localized to challenging conditions such as changing visibility, particles, and dramatic lighting changes. By completing the workflow, you’ll measure the performance benefit and have the tools to evaluate those edge cases against your quality target.
Use Streamline and RenderDoc to validate NFRU from two directions:
- Use Streamline to confirm that NFRU is active, measure the GPU and neural workload, and check whether frame generation fits within the frame budget.
- Use RenderDoc to confirm generated-frame quality and investigate any localized differences in the frame-generation inputs, visible intermediate resources, and final interpolated frame.
Prepare a repeatable test
Before collecting data, choose a short camera path or gameplay action that can be repeated with NFRU disabled and enabled. Keep the camera path, resolution, graphics settings, and test conditions as consistent as possible.
For Moku, multiple sequences are prepared for demonstration, including 30-second, 5-second, and fixed-camera sequences. Additional test sequences are also created for specific scenarios. Each sequence is treated as a reference cut so that the same content can be replayed consistently across test runs.
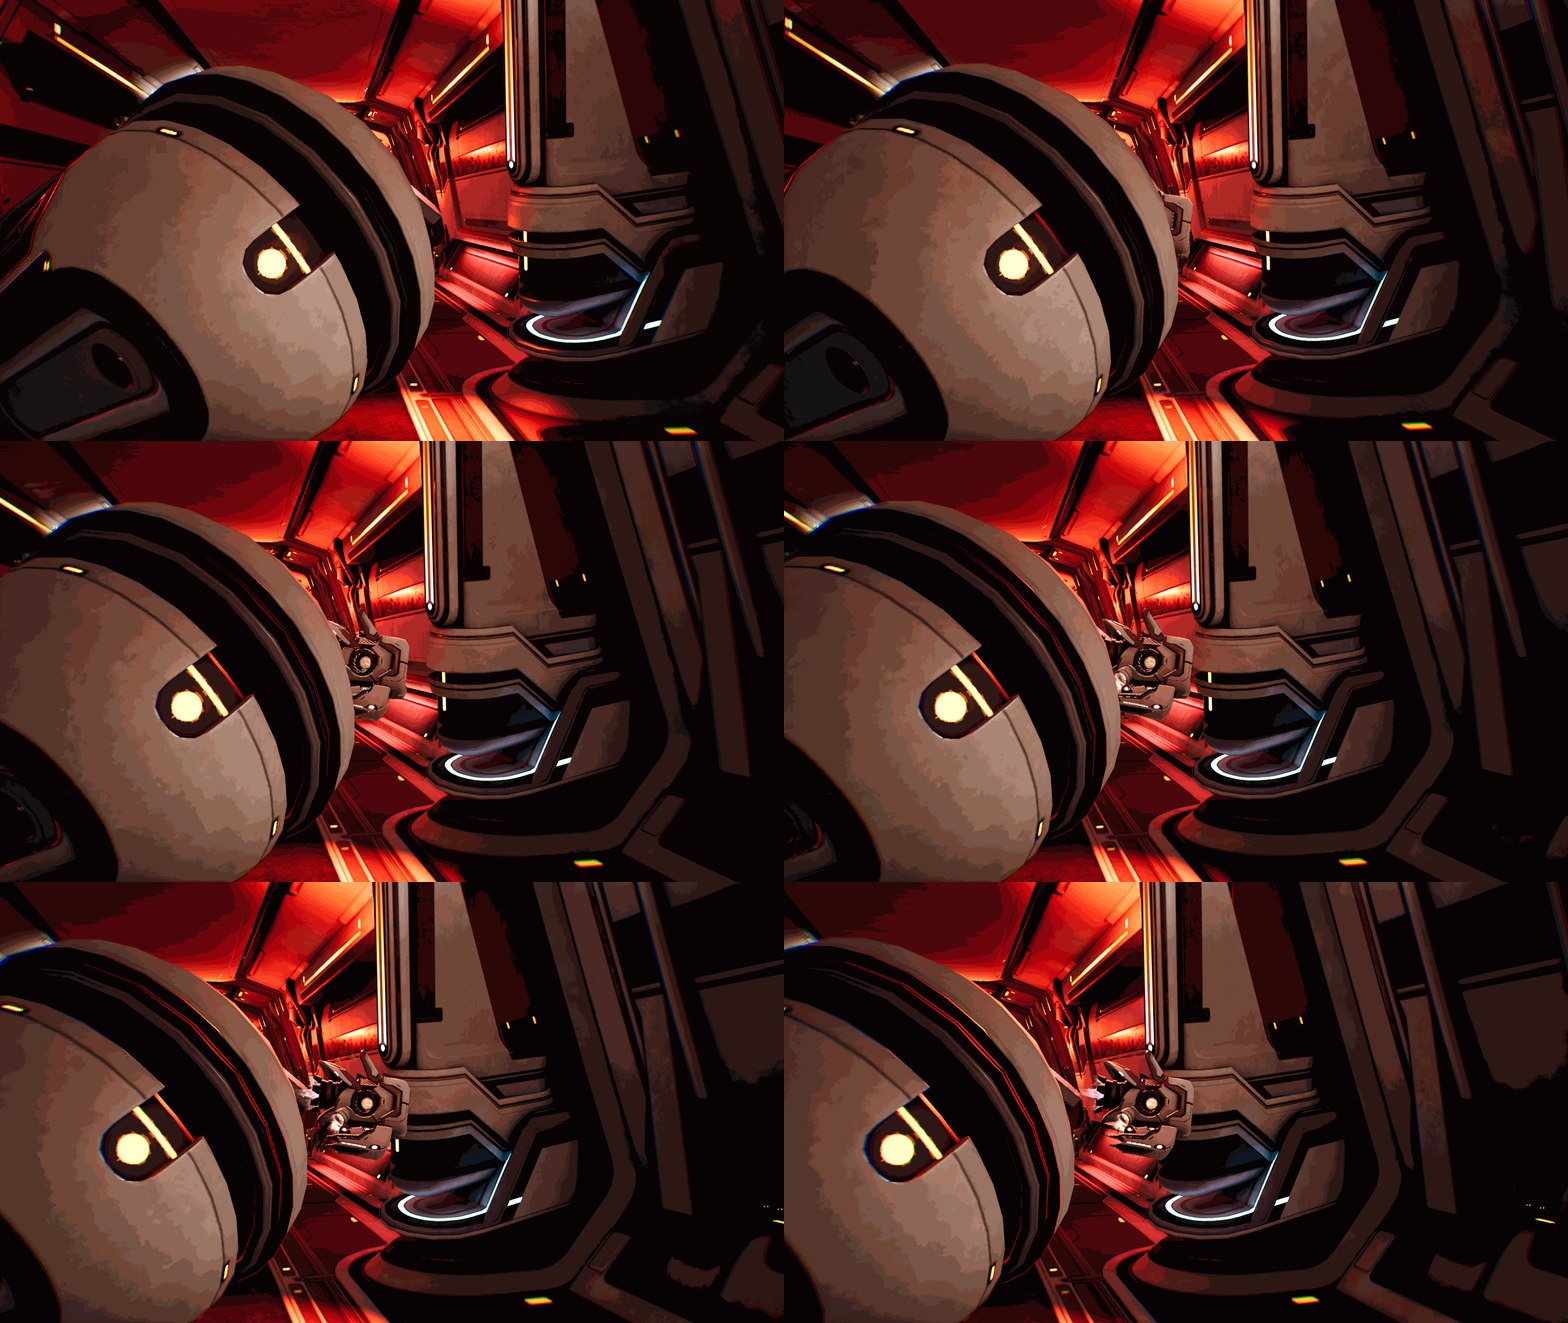
Different device profiles are configured to control whether NFRU is enabled, disabled, or running in debug mode. For example:
[Moku_SM5_NoNeural DeviceProfile]
DeviceType=Android
BaseProfileName=Moku_SM5_Base
+CVars=r.NFRU.Enable=0

[Moku_SM5_NFRU DeviceProfile]
DeviceType=Android
BaseProfileName=Moku_SM5_Base
+CVars=r.NFRU.Enable=1

[Moku_SM5_NFRU_Debug DeviceProfile]
DeviceType=Android
BaseProfileName=Moku_SM5_Base
; Development/test builds only
+CVars=r.NFRU.OnlyInterpolatedFrames=1
+CVars=r.NFRU.Enable=1
With these profiles, you can launch the test through ADB using a fixed device profile and reference cut:
adb shell am start -S -n [package_name]/com.epicgames.unreal.GameActivity --es cmdline '-dp=Moku_SM5_NFRU -referenceCut=TestSequence'
For additional visual debugging, use r.NFRU.ShowDebugView to display the frame interpolation debug view. Use r.NFRU.OnlyInterpolatedFrames when you want to focus only on generated frames. Use r.NFRU.CaptureDebugUI when the debug UI or overlays need to be included in the captured path.
r.NFRU.ShowDebugView and r.NFRU.OnlyInterpolatedFrames are intended for development and test builds, and might not be available in shipping builds.
In NFRU debug resource names, tm1 means time minus one (t-1) and tp1 means time plus one (t+1) relative to the generated frame time. These names might not always match the simpler “previous” or “current” labels used in comparison images.
Profile NFRU with Streamline
Use Streamline to compare the same scene with NFRU disabled and enabled. In the NFRU-enabled capture, confirm that the neural processing counters are active. Check that the additional GPU work, such as compute activity and memory bandwidth, fits within the frame budget.
As shown in the capture, counters such as Neural queue active and Neural Accelerator Unit Usage are active. The active counters indicate neural accelerator activity during the NFRU workload. You can use the measured active time from these counters to evaluate the performance cost of NFRU. Moku also integrates the Streamline API, so Streamline captures can record both render FPS and present FPS at the same time.
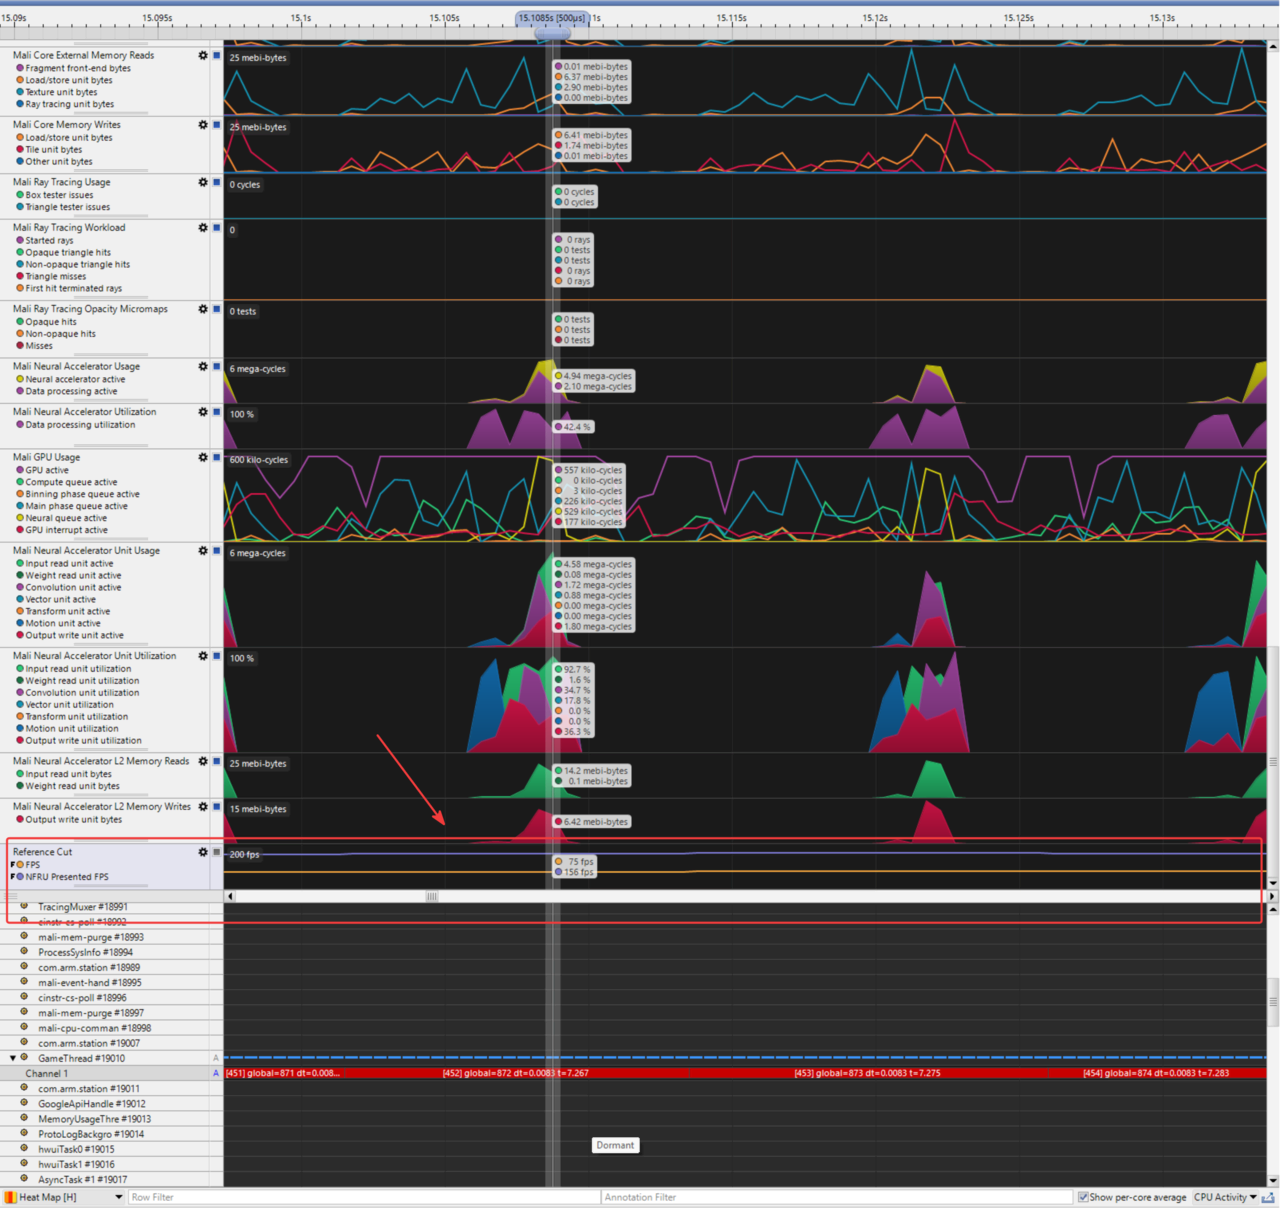
On the timeline, the NFRU workload should complete cleanly between real rendered frames. If GPU or neural processing blocks become long, the cost of NFRU might limit the expected uplift. If the workload is light but idle gaps still appear, the limiting factor is more likely frame pacing or presentation behavior rather than NFRU execution cost. For more information, see NFRU performance .
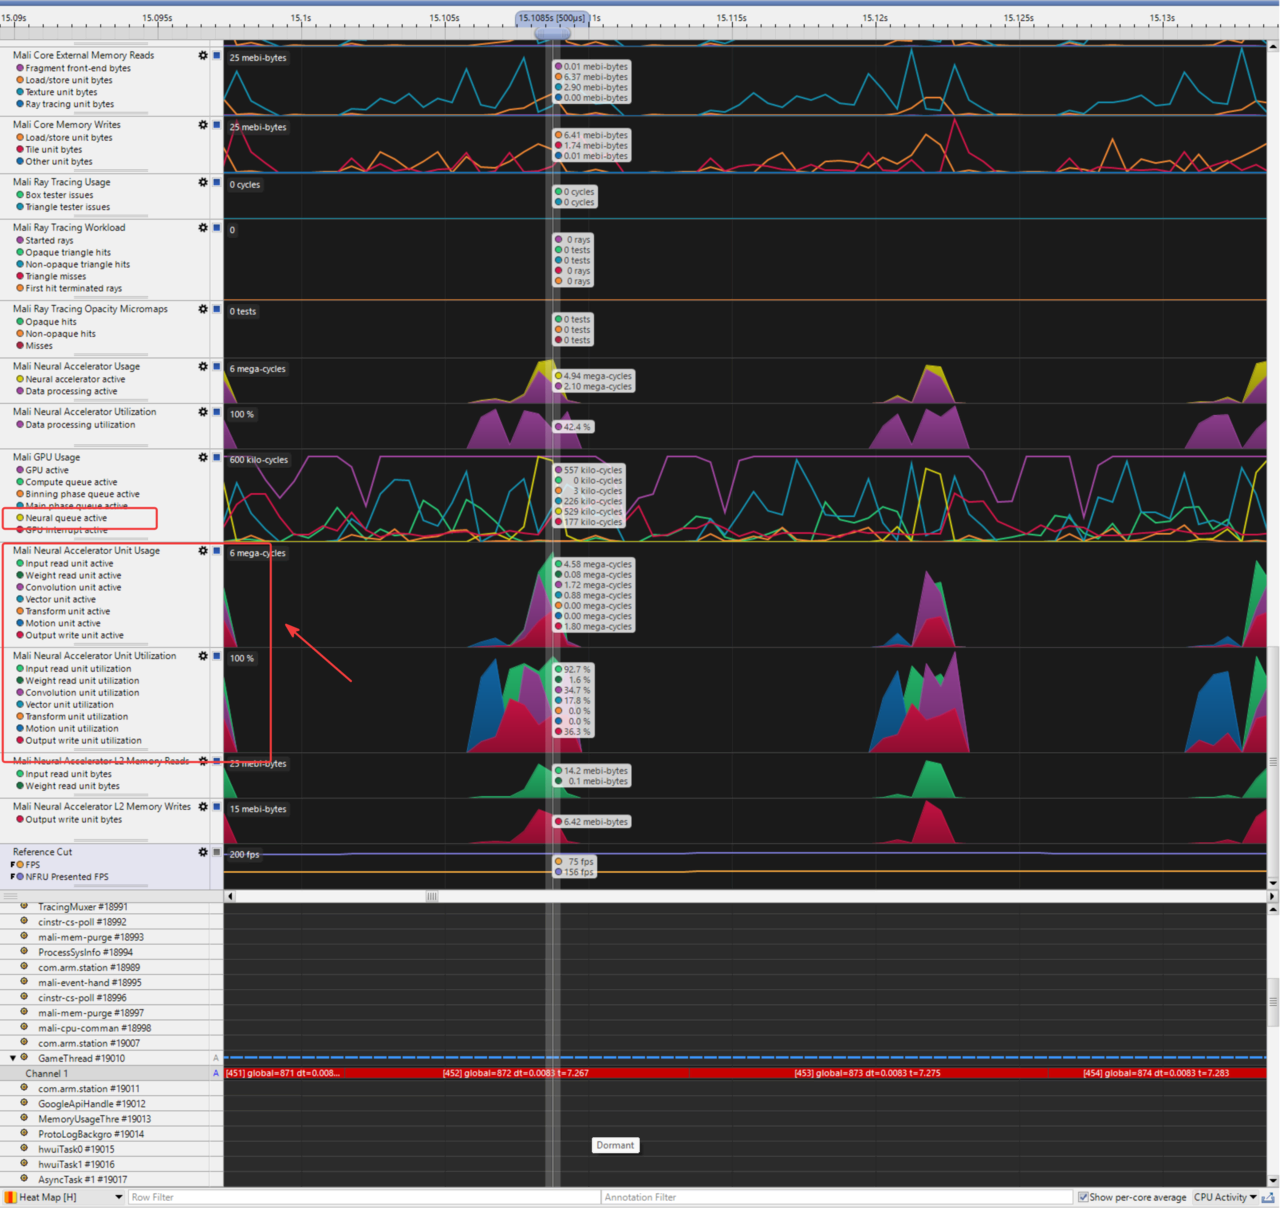
For more information on performance profiling strategies, see Use Arm Streamline to capture data for your application .
Inspect NFRU frames with RenderDoc
Use RenderDoc to confirm generated-frame quality and investigate any visible differences. Capture a frame with NFRU enabled and inspect the frame generation area of the event list.
Compare the real frame copies with the generated output. Then, review the bound frame-generation resources and debug-view tiles that expose motion, depth, disocclusion, and warped-color behavior.
If the real frame inputs look correct but the generated output has artifacts, the issue is likely in one of the following:
- Frame generation
- Masking
- Disocclusion handling
- Content, such as rapidly changing alpha-blended effects
For detailed guidance on using RenderDoc in Unreal Engine, see Use RenderDoc for Arm GPUs with NFRU for debugging and analysis .
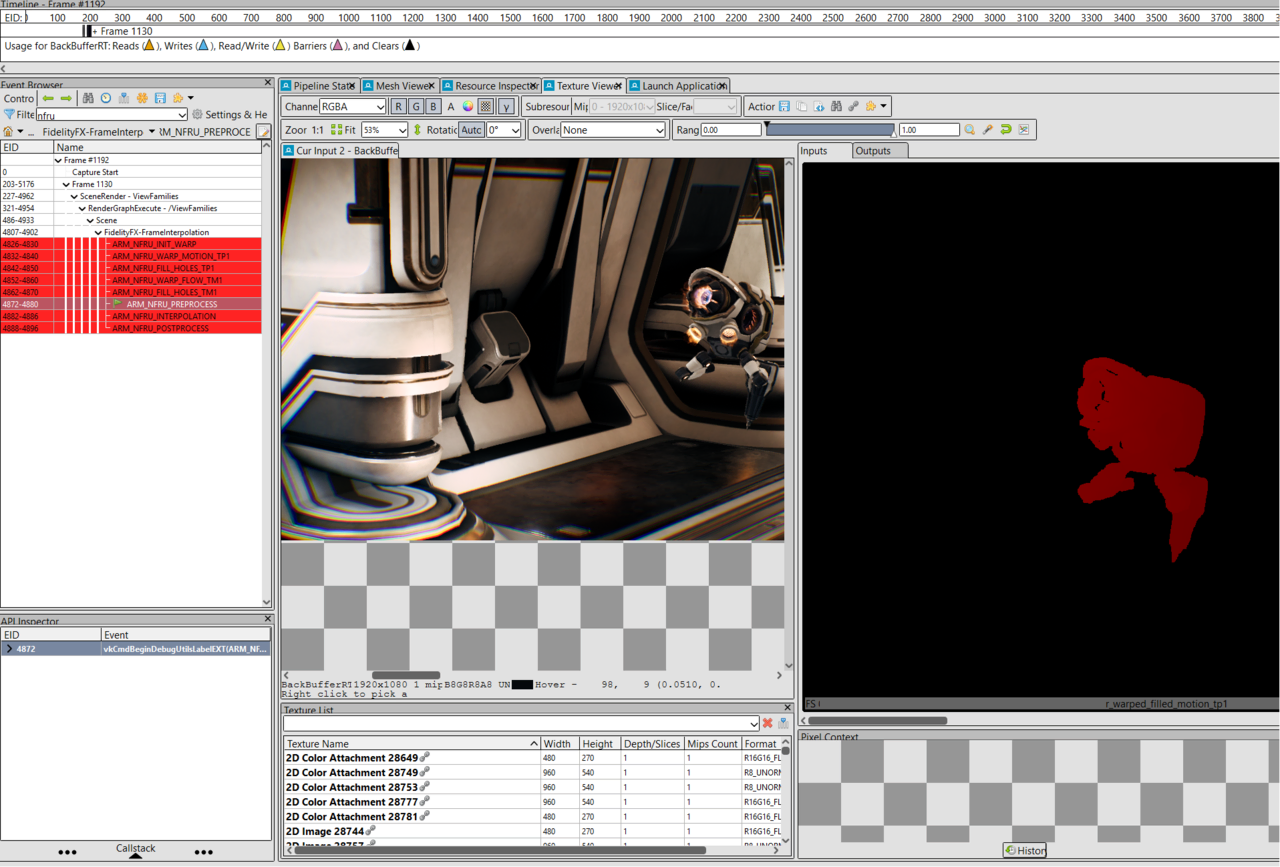
Use the following steps to inspect the Arm Frame Interpolation pipelines in RenderDoc:
| Step | Event or pipeline | What to inspect |
|---|---|---|
| 1 | FidelityFX-FrameInterpolation | In the Event Browser, find the NFRU frame-generation work and expand the child events until you see pipeline names that start with ARM_NFRU_. |
| 2 | ARM_NFRU_INIT_WARP | This pass initializes the warp and hole-tracking resources used by later passes. On reset frames, the capture might show only the initialization and seeding work instead of the full interpolation sequence. |
| 3 | ARM_NFRU_DOWNSAMPLE_OF_COLOUR | If this optional pass appears, check it before the main interpolation passes. It creates lower-resolution color inputs for optical-flow processing when the source color is larger than the internal optical-flow input size. |
| 4 | ARM_NFRU_WARP_MOTION_TP1 | This pass uses the current frame motion vectors and depth to warp visible data toward the generated frame time. Edge errors here usually point to motion vector, depth, or velocity conversion issues. |
| 5 | ARM_NFRU_WARP_FLOW_TM1 | This pass uses optical flow and the previous-frame depth path to warp data from t-1 toward the generated frame time. Problems here often appear around disocclusion, camera motion, or areas where optical flow can’t track the content reliably. |
| 6 | ARM_NFRU_FILL_HOLES_TP1 and ARM_NFRU_FILL_HOLES_TM1 | These passes fill gaps left by the motion-vector and optical-flow warps. Remaining gaps or noisy fill regions usually indicate difficult disocclusion, thin geometry, fast motion, or unreliable history. |
| 7 | ARM_NFRU_PREPROCESS | This pass prepares the tensor input from color, depth, motion, optical flow, masks, and warp results. Verify that the bound current and previous color, depth, and motion resources match the frame you intended to capture. |
| 8 | ARM_NFRU_INTERPOLATION | This is the neural frame-interpolation data-graph workload. RenderDoc might not expose the tensor contents like a normal color texture, but the event confirms that the neural interpolation stage ran. |
| 9 | ARM_NFRU_POSTPROCESS | This pass converts the interpolation result back to the output image and writes the generated frame. Compare this output with the real frame copies and the final back buffer. |
| 10 | ARM_NFRU_DEBUG_VIEW | If debug view is enabled, inspect this event after postprocess. Use it to compare the visible debug tiles for motion, depth, disocclusion, warped color, and final generated output. |
You can open the bound textures from the RenderDoc Pipeline State view or Resource Inspector, then view them in the Texture Viewer. For masks, depth, motion, and flow textures, select individual channels or adjust the range in the Texture Viewer to make the data easier to inspect. Some names in the list are shader binding names rather than texture allocation names. In those cases, open the texture bound to that shader input or output.
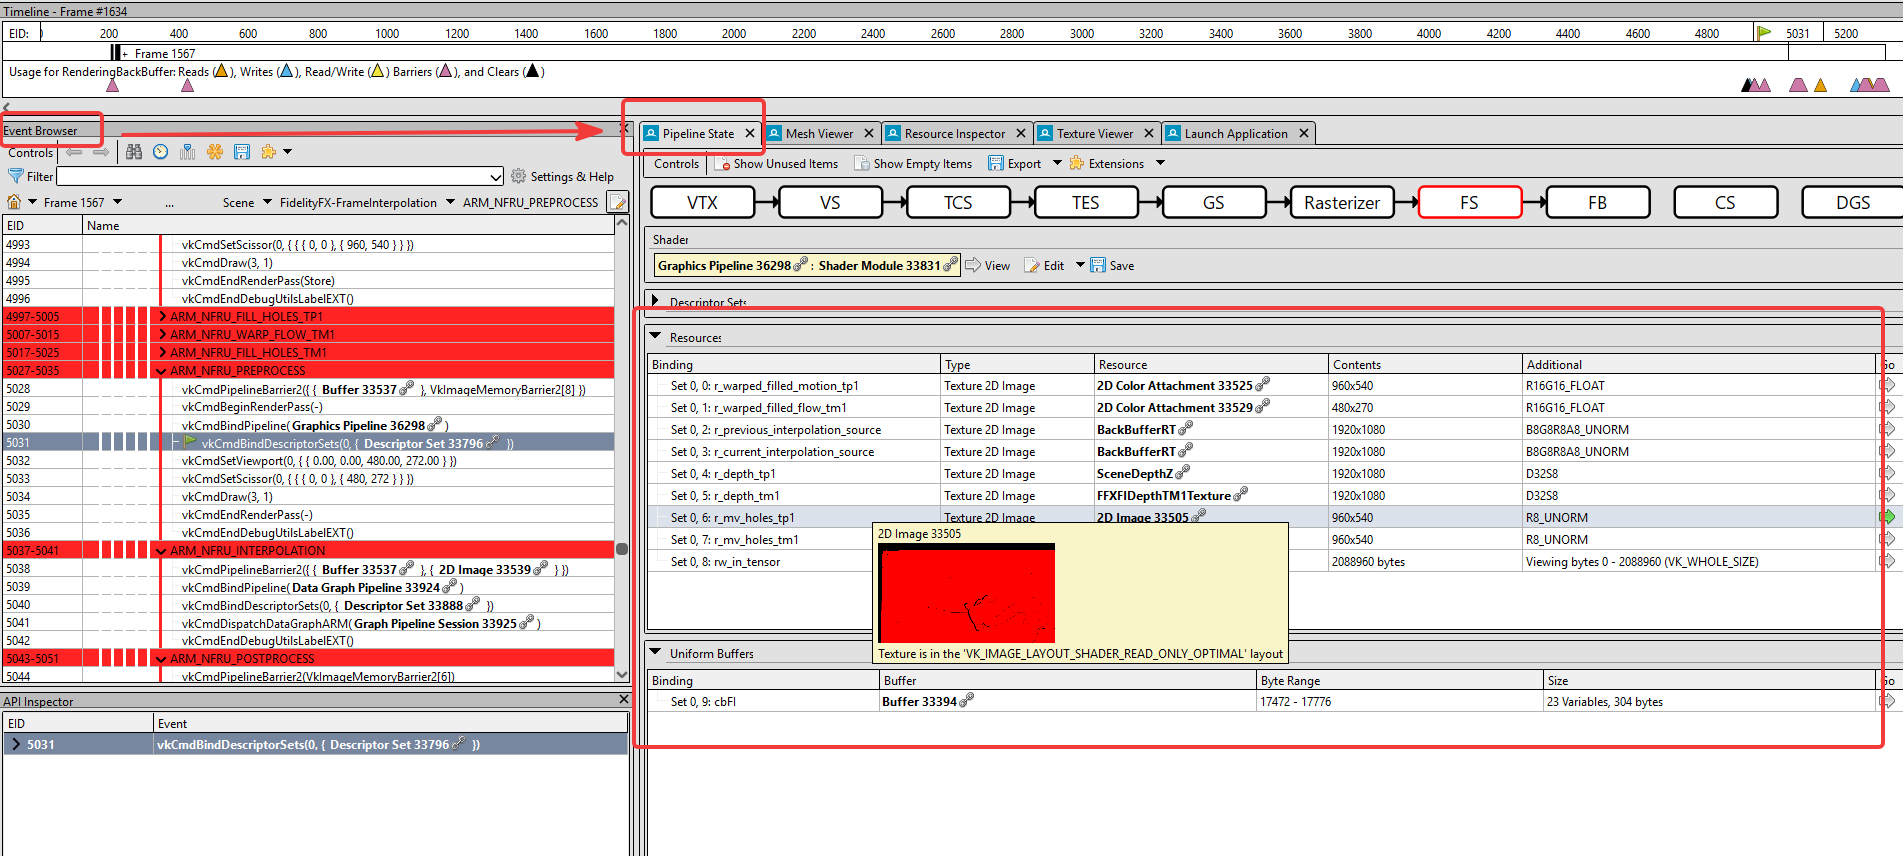
Common resources to check include:
| Resource | What to check |
|---|---|
InterpolatedRT | Generated frame target before it’s copied or presented. In ARM_NFRU_POSTPROCESS, the target is typically the texture bound behind rw_output. |
r_current_interpolation_source | Current rendered color input |
r_previous_interpolation_source | Previous rendered color input |
r_motion_tp1 | Current-frame motion vectors. View the red and green channels to check direction and magnitude. |
r_depth_tp1 and r_depth_tm1 | Current and previous depth inputs. Use these inputs when checking disocclusion, edge, and occlusion-history artifacts. |
r_flow_tm1 | Previous-frame optical-flow input |
r_dynamic_mask_tp1 and r_dynamic_mask_tm1 | Dynamic masks for the current-frame (t+1) and previous-frame (t-1) inputs |
r_mv_holes_tp1 and r_mv_holes_tm1 | Hole masks generated by the warp stages |
r_warped_filled_motion_tp1 and r_warped_filled_flow_tm1 | Filled warp results after the hole-filling passes |
r_in_tensor and r_out_params_tensor | Neural input and output tensor resources. These resources might not display like normal color textures, but their bindings confirm the neural path resources are present. |
This workflow is useful for the artifact scenarios in the following sections. Occlusion changes stress depth history. Alpha-blended particles and VFX stress content that doesn’t always have reliable depth or motion vector data. Lighting changes stress optical flow, blend parameters, and screen-edge reconstruction.
What you’ve learned and what’s next
You’ve now learned how to validate NFRU using Streamline and RenderDoc. Streamline confirms whether NFRU is active, measures the GPU and neural workload, and shows how effectively available frame time becomes a higher presentation rate. RenderDoc confirms generated-frame quality and trace localized differences through the frame-generation event list, visible NFRU resources, real frame copies, debug-view output, and final generated output.
Together, these tools make smoother NFRU presentation measurable and its edge cases actionable.
Next, you’ll evaluate NFRU performance and visual quality in representative gameplay scenarios.