Profile Android game performance in Godot with Arm Performance Studio
Introduction
Profile your Godot game with Arm Performance Studio
Install the Arm Performance Studio extension in Godot
Annotate Game Events for Profiling in Godot
Define performance regions in Godot
Use channels for threaded performance annotations
Create and track custom counters in Godot
Use custom activity maps in Godot profiling
Next Steps
Defining regions in your Godot project
To define regions of interest within the game, you can specify a pair of markers prefixed with Region Start and Region End, for example:
performance_studio.marker("Region Start Times Square")
# Do work
performance_studio.marker("Region End Times Square")
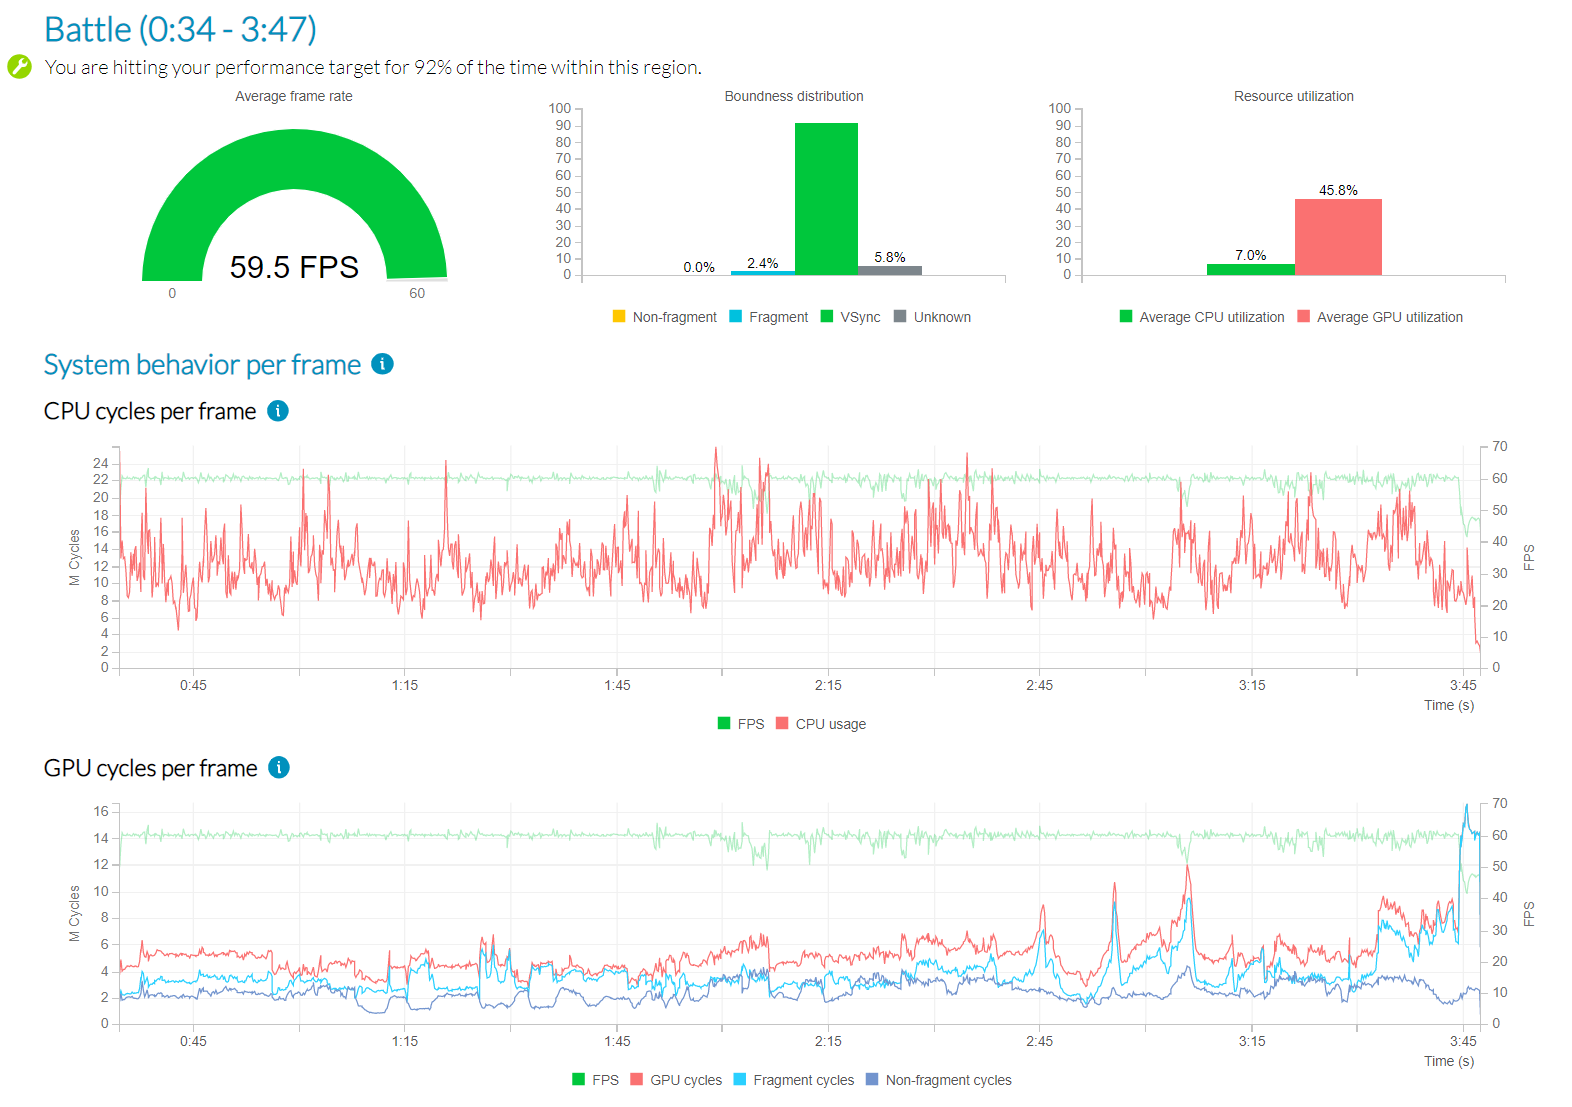
These regions are shown on the frame rate analysis chart in the Performance Advisor report.
 Regions in Performance Advisor
Performance Advisor also includes dedicated charts for each region at the end of the report, allowing you to analyze them independently.
 Dedicated region charts in Performance Advisor