Profile Android game performance in Godot with Arm Performance Studio
Introduction
Profile your Godot game with Arm Performance Studio
Install the Arm Performance Studio extension in Godot
Annotate Game Events for Profiling in Godot
Define performance regions in Godot
Use channels for threaded performance annotations
Create and track custom counters in Godot
Use custom activity maps in Godot profiling
Next Steps
Use the Performance Studio extension in your project
All annotation features are provided through the PerformanceStudio class. To begin, create an instance in your script:
var performance_studio = PerformanceStudio.new()
Add single markers to highlight key game events
The simplest annotations are single markers. These appear in the Streamline timeline and help you correlate game behavior with performance data.
To emit a basic marker, use the marker() method with a descriptive label:
performance_studio.marker("Game Started")
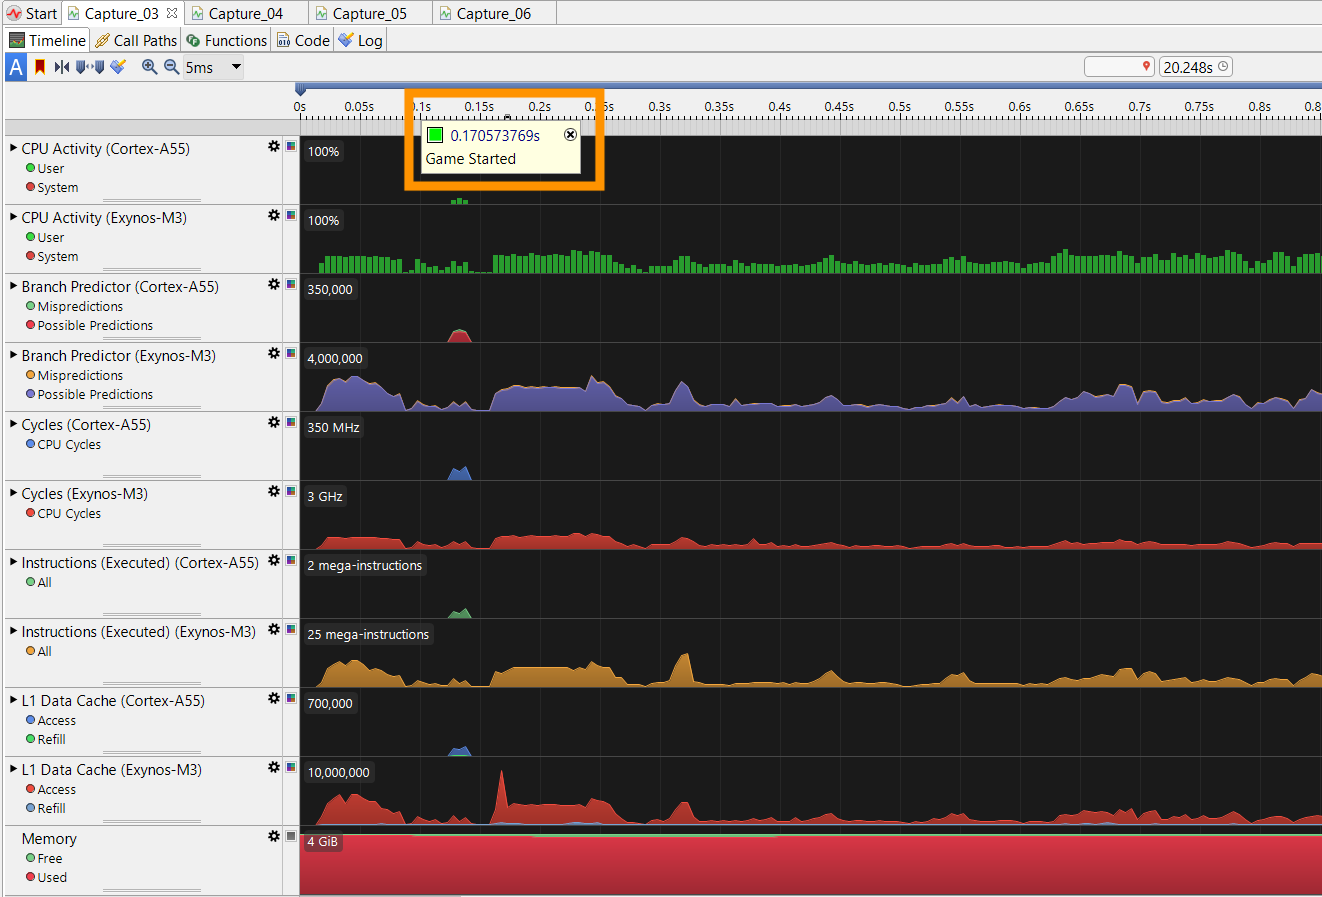
This creates a timestamped marker labeled Game Started. When you capture a profile in Streamline, you’ll see this marker at the point the game starts.
 Marker annotation in Streamline
Assign a custom color
You can assign a color to the marker using the marker_color() method:
performance_studio.marker_color("Game Started", Color8(0, 255, 0))
This example displays the Game Started marker in green. Use different colors to visually distinguish important game events.