Analyze a frame from an Android application with Frame Advisor
Introduction
Understand Frame Advisor and get support
Capture a trace in Frame Advisor
Analyze draw calls in Frame Advisor
Analyze frame construction with the Render Graph in Frame Advisor
Analyze mesh geometry with Content Metrics on Frame Advisor
Next Steps
Analyze a frame from an Android application with Frame Advisor
Find inefficient geometry
Use the Content Metrics view in Frame Advisor to find geometry-related problems with the objects in the scene. This view shows a range of useful metrics, broken down by frame, render pass, and draw call.
To find geometry-related problems using the view, follow these steps:
In the Content Metrics view, select Draws and sort the table by the highest number of primitives (Prims) to find the most complex objects.
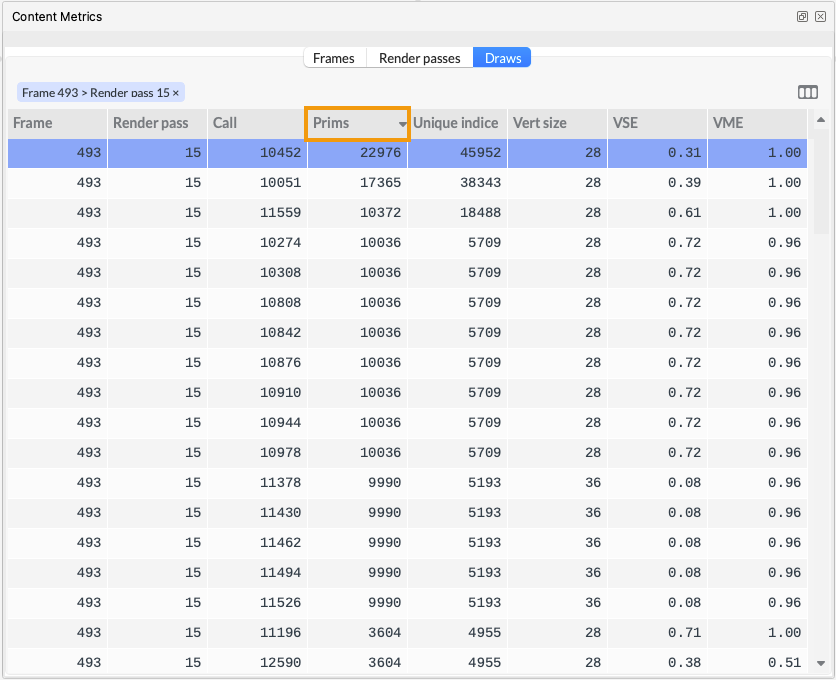 Sorting Content Metrics view by primitives
Right-click the draw call at the top of the list and choose Navigate to call. The complex object is now selected in the Frame Hierarchy view and visible in the Framebuffers view.
The object in the example is the Sphinx model, built using almost 23,000 primitives. This is a high number for a game object on mobile. If you encounter a high number, first determine whether the model can be simplified. Fewer primitives reduce GPU processing cost and memory bandwidth.
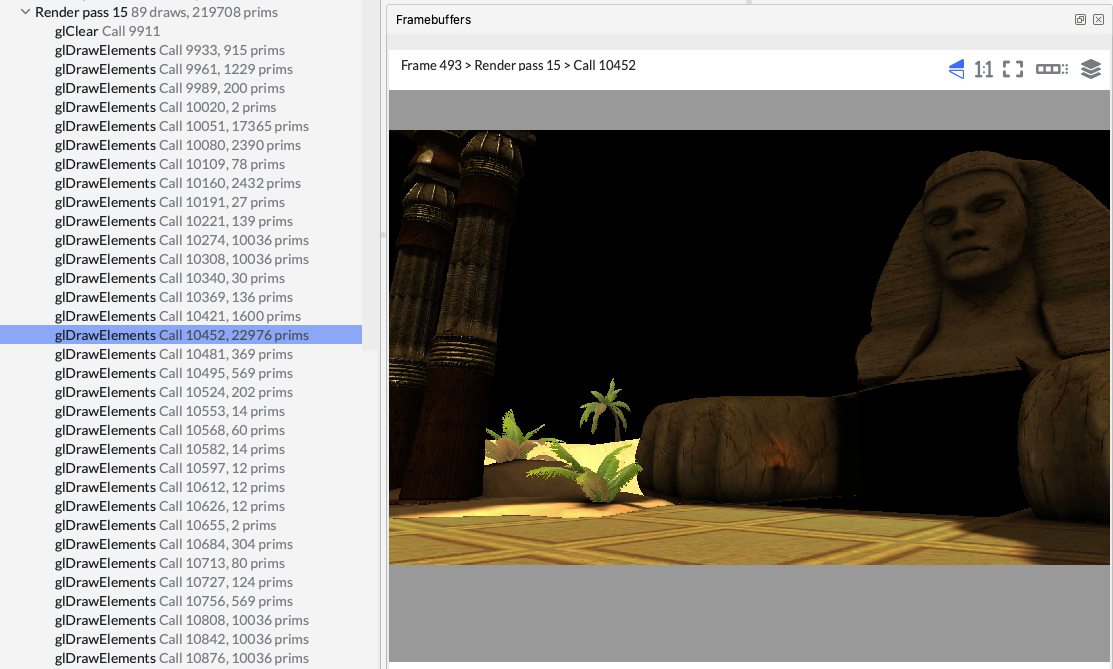 The Sphinx model shown in the Framebuffers view
In cases where the model can’t be simplified any further, there are other options to consider.
Look at the Detailed Metrics view. The view shows a range of metrics about the mesh. The example Sphinx mesh uses almost 46,000 indices, and each index is used by two primitives, showing some index reuse.
However, almost 32,000 of the vertices are duplicates, which means they have identical data to another vertex in the model. It’s worth removing the duplicate vertices, which would give a significant reduction in processing cost and memory bandwidth.
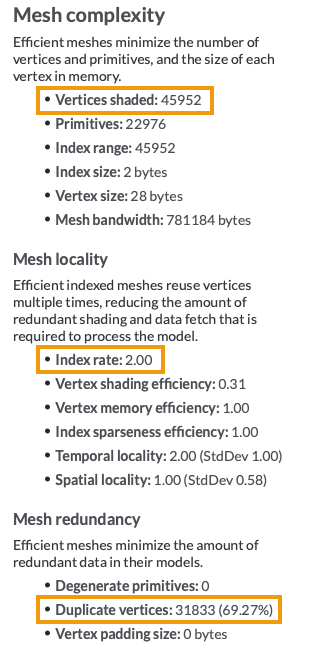 The Detailed Metrics view in Frame Advisor
To see full descriptions of all the metrics in the Detailed Metrics view, use the information button.
Next, sort the Content Metrics table by lowest vertex shading efficiency (VSE). This identifies objects that shade more indices than they use. Gaps in the index stream can cause unused indices to be shaded. Poor reuse locality can cause indices to be shaded multiple times.
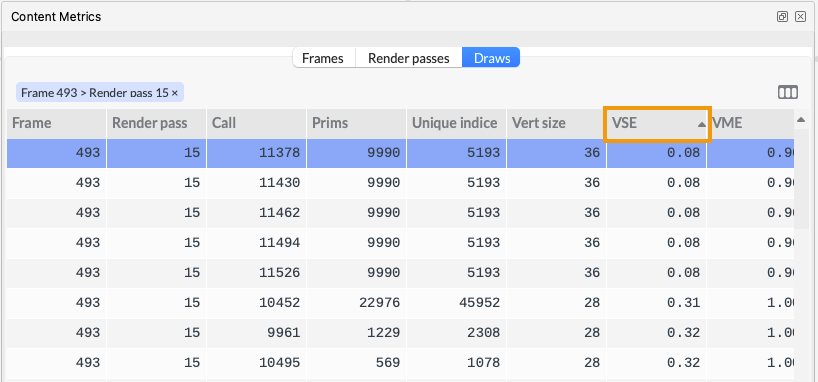 Content Metrics sorted by VSE
VSE values range from 0 to 1. A VSE of 1 indicates optimal shading, with one shader invocation per useful input vertex. An efficiency of 0.5 indicates that there are two shader invocations per useful input vertex.
The object with the lowest VSE in the example is the snake head statue model. There are five instances of this model in the scene, although only three are partially visible in this frame.
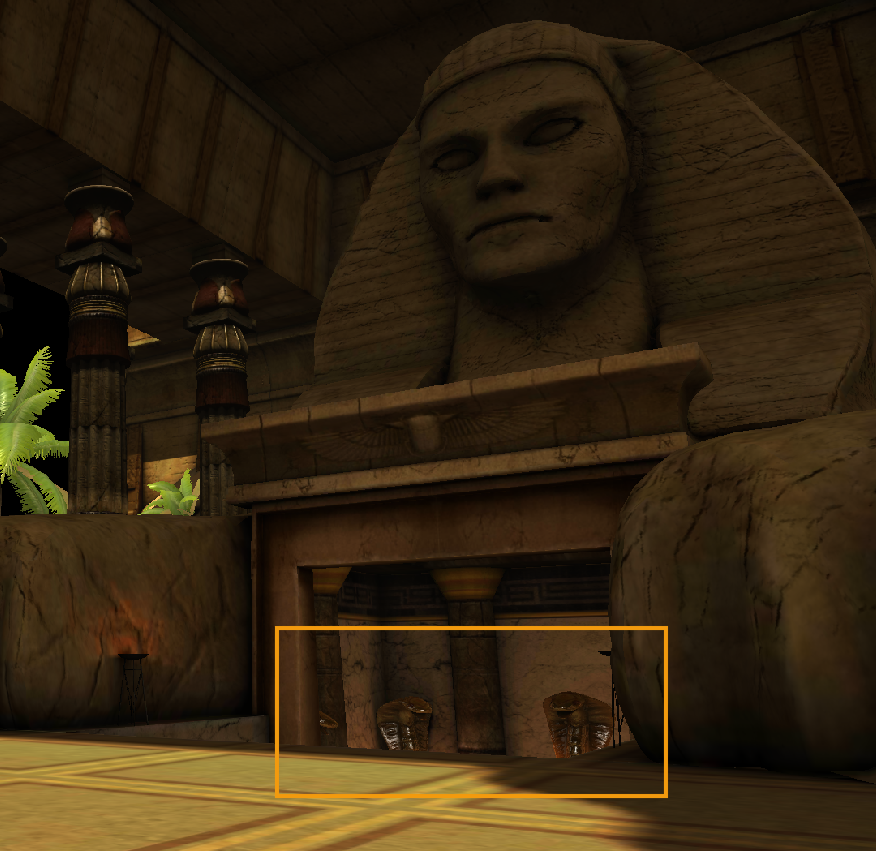 The snake head statues shown in the Framebuffers view
For this model, the Detailed Metrics view shows that over 5000 indices are used to create almost 10,000 primitives, which is reasonable. However, over 64,000 vertices are being shaded. This is far higher than the index count, which means that some vertices are being shaded multiple times. This is wasteful.
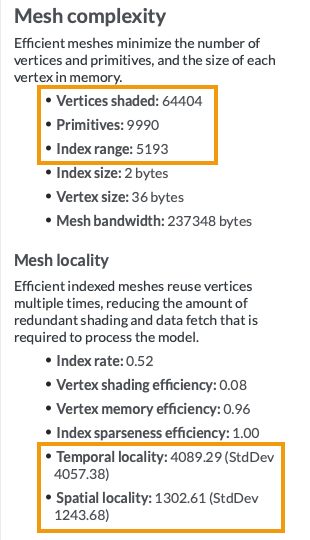 Detailed metrics for the snake head statues
The report also shows that the temporal and spatial locality figures for the example are very high.
Temporal locality shows that, on average, there are over 4000 indices between reuse of an index value. This number of indices is much larger than the post-transform cache on many mainstream Arm GPUs, which can store 1024 indices. This means that vertices are likely to be evicted from the cache before an index is reused, resulting in reshading.
Ideally, index temporal locality should be under 500 to maximize the chance of post-transform cache hits. To reduce temporal locality, try reordering the data to move reuses closer together in the index buffer.
Spatial locality shows that, on average, there are around 1300 indices between neighbouring indices. This means that data for a single primitive is likely to be far apart in memory, which can reduce the effectiveness of the shader core data caches during vertex shading.
Spatial locality should be kept as low as possible, ensuring that vertices within neighbouring primitives are using data that is the same set of cache lines and memory pages. To reduce spatial locality, try reordering the data to move neighbours closer together in the source data buffer.
What you’ve accomplished
You’ve used the Content Metrics view in Frame Advisor to identify inefficient geometry in the captured frame.
You’ve learned how to use Frame Advisor to analyze a captured frame. You can use these steps to capture and analyze more frames from your applications.