Analyze a frame from an Android application with Frame Advisor
Introduction
Understand Frame Advisor and get support
Capture a trace in Frame Advisor
Analyze draw calls in Frame Advisor
Analyze frame construction with the Render Graph in Frame Advisor
Analyze mesh geometry with Content Metrics on Frame Advisor
Next Steps
Analyze a frame from an Android application with Frame Advisor
Inspect draw calls
When the analysis completes, you’ll see Frame Advisor’s Analysis screen. To inspect draw calls, follow these steps:
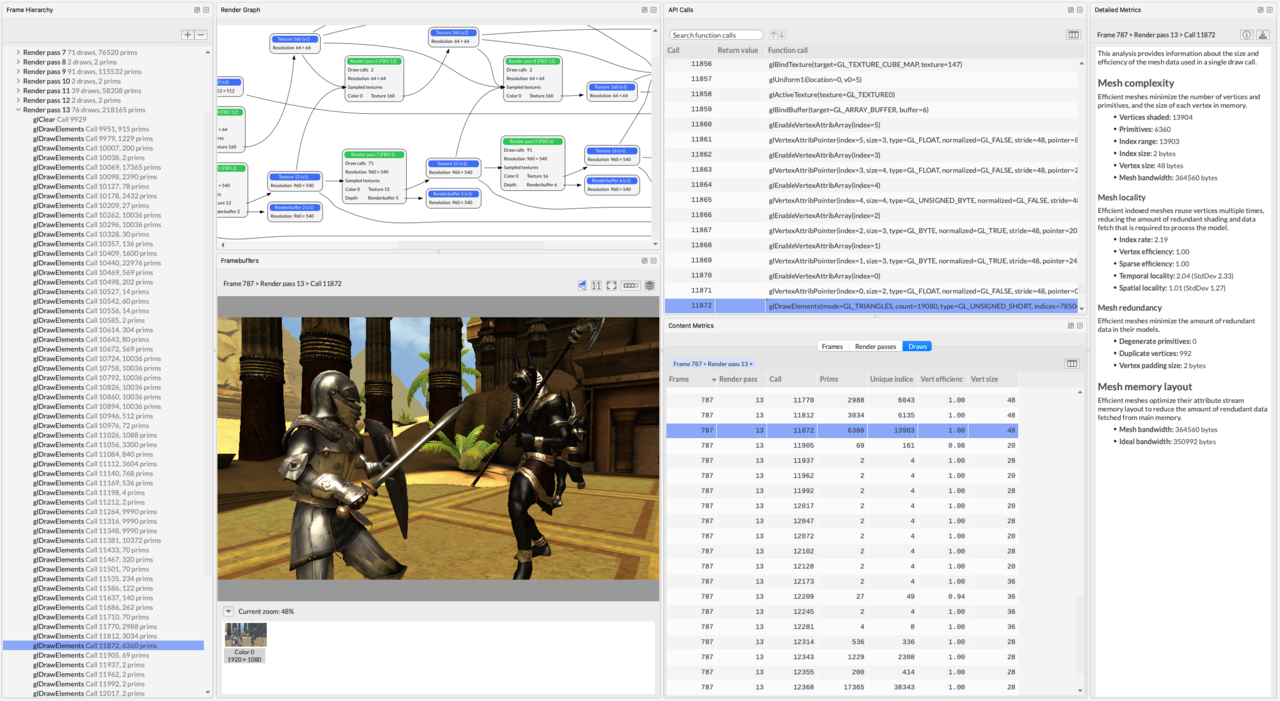 Frame Advisor's Analysis screen
To view a list of captured frames, expand the Frame hierarchy view. The example frame draws over 657,000 primitives using 426 draw calls within 16 render passes.
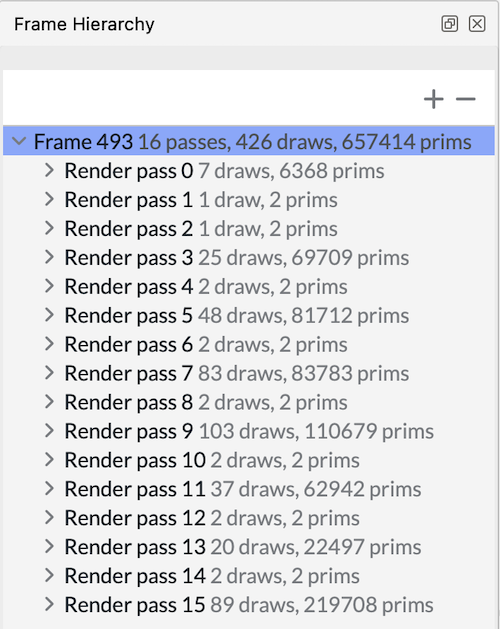 The Frame Hierarchy view in Frame Advisor
The Frame hierarchy shows all the render passes that make up the frame. Expand a render pass to inspect its draw calls. Step through the draw calls and observe how each one changes the framebuffer to see how the scene is built.
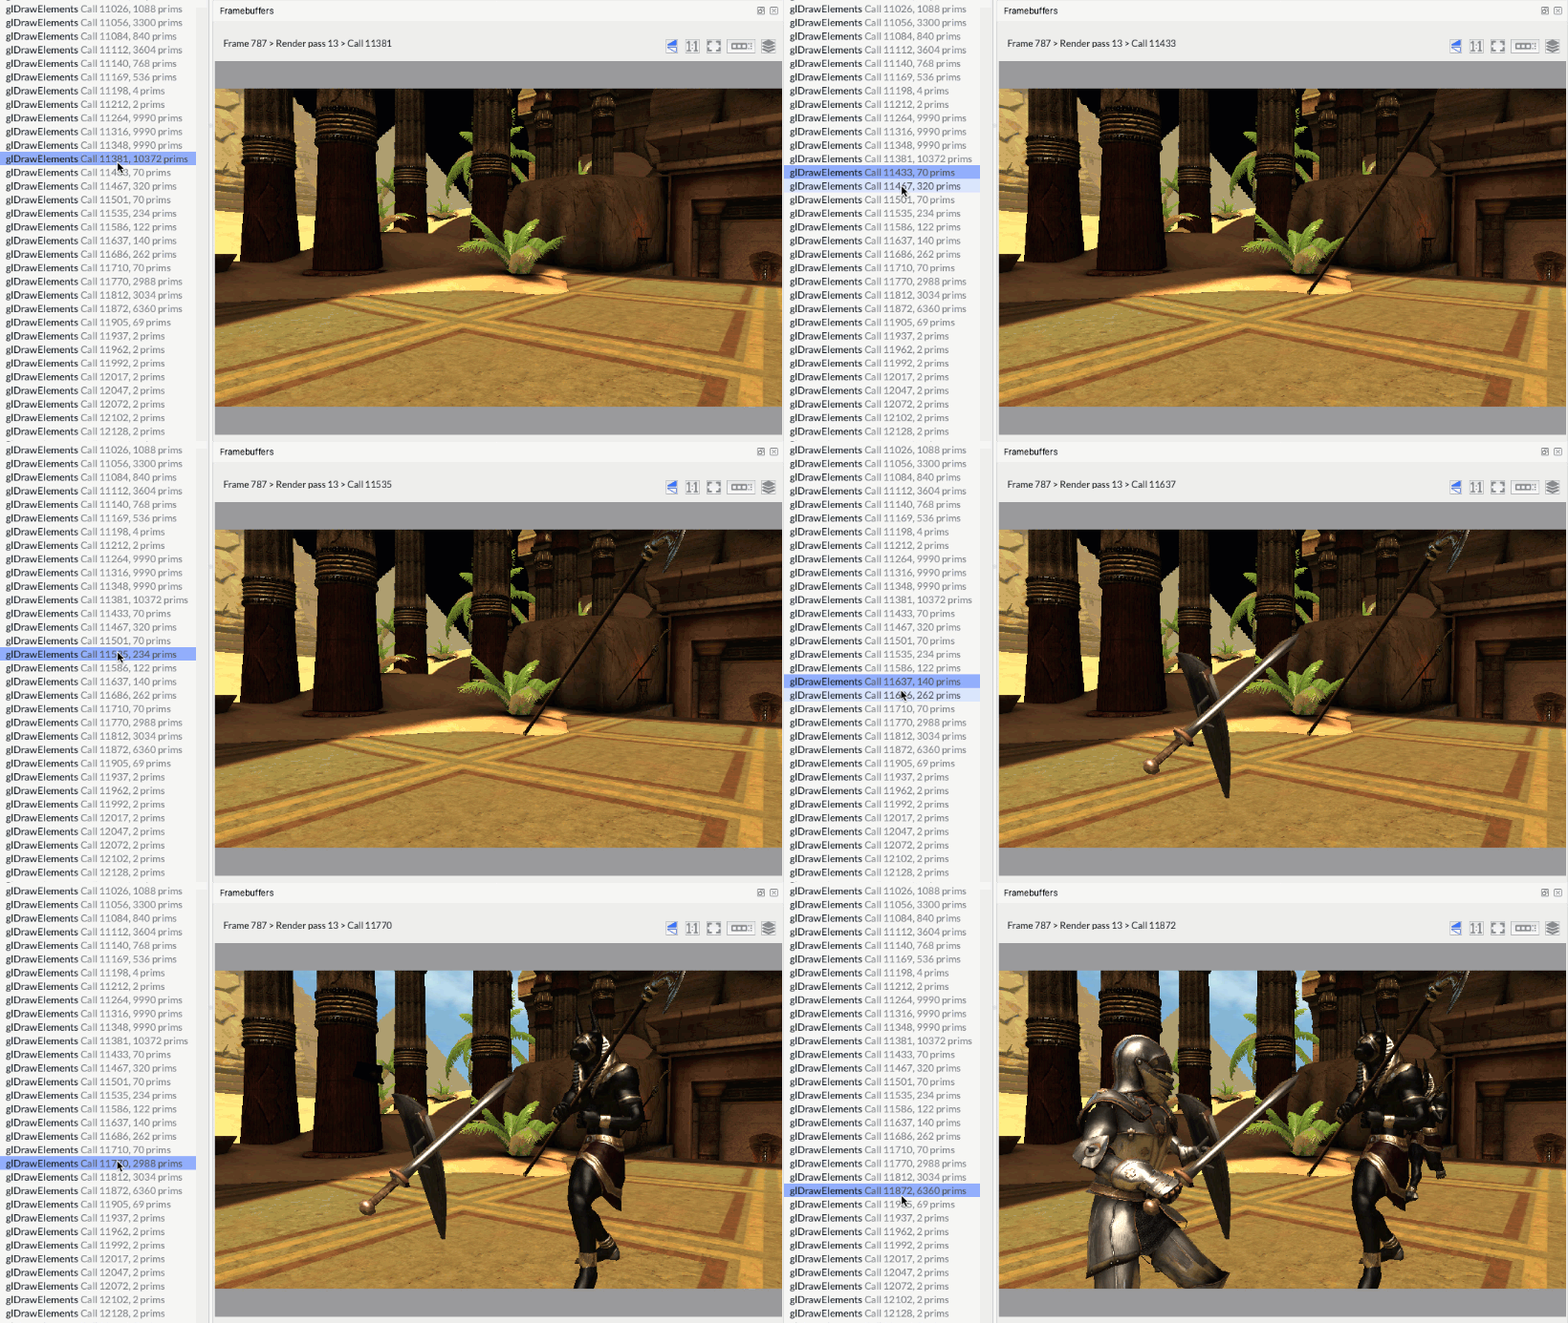 Stepping through draw calls in Frame Advisor
Draw calls are expensive for the CPU to process, so reduce their number where possible. Look for draw calls that don’t render visible changes to the framebuffer. A draw that makes no visible change can be outside the frustum or behind another object. Use software culling techniques to eliminate these draws.
Some objects might be drawn with a large number of primitives. As an object is drawn, compare its level of detail with its size and position on screen. Using simpler meshes, particularly for objects far from the camera, can significantly increase performance.
Look for many identical objects being drawn individually, such as these pillars. To reduce the number of draw calls, consider batching multiple objects into a single combined mesh or using an instanced draw call.
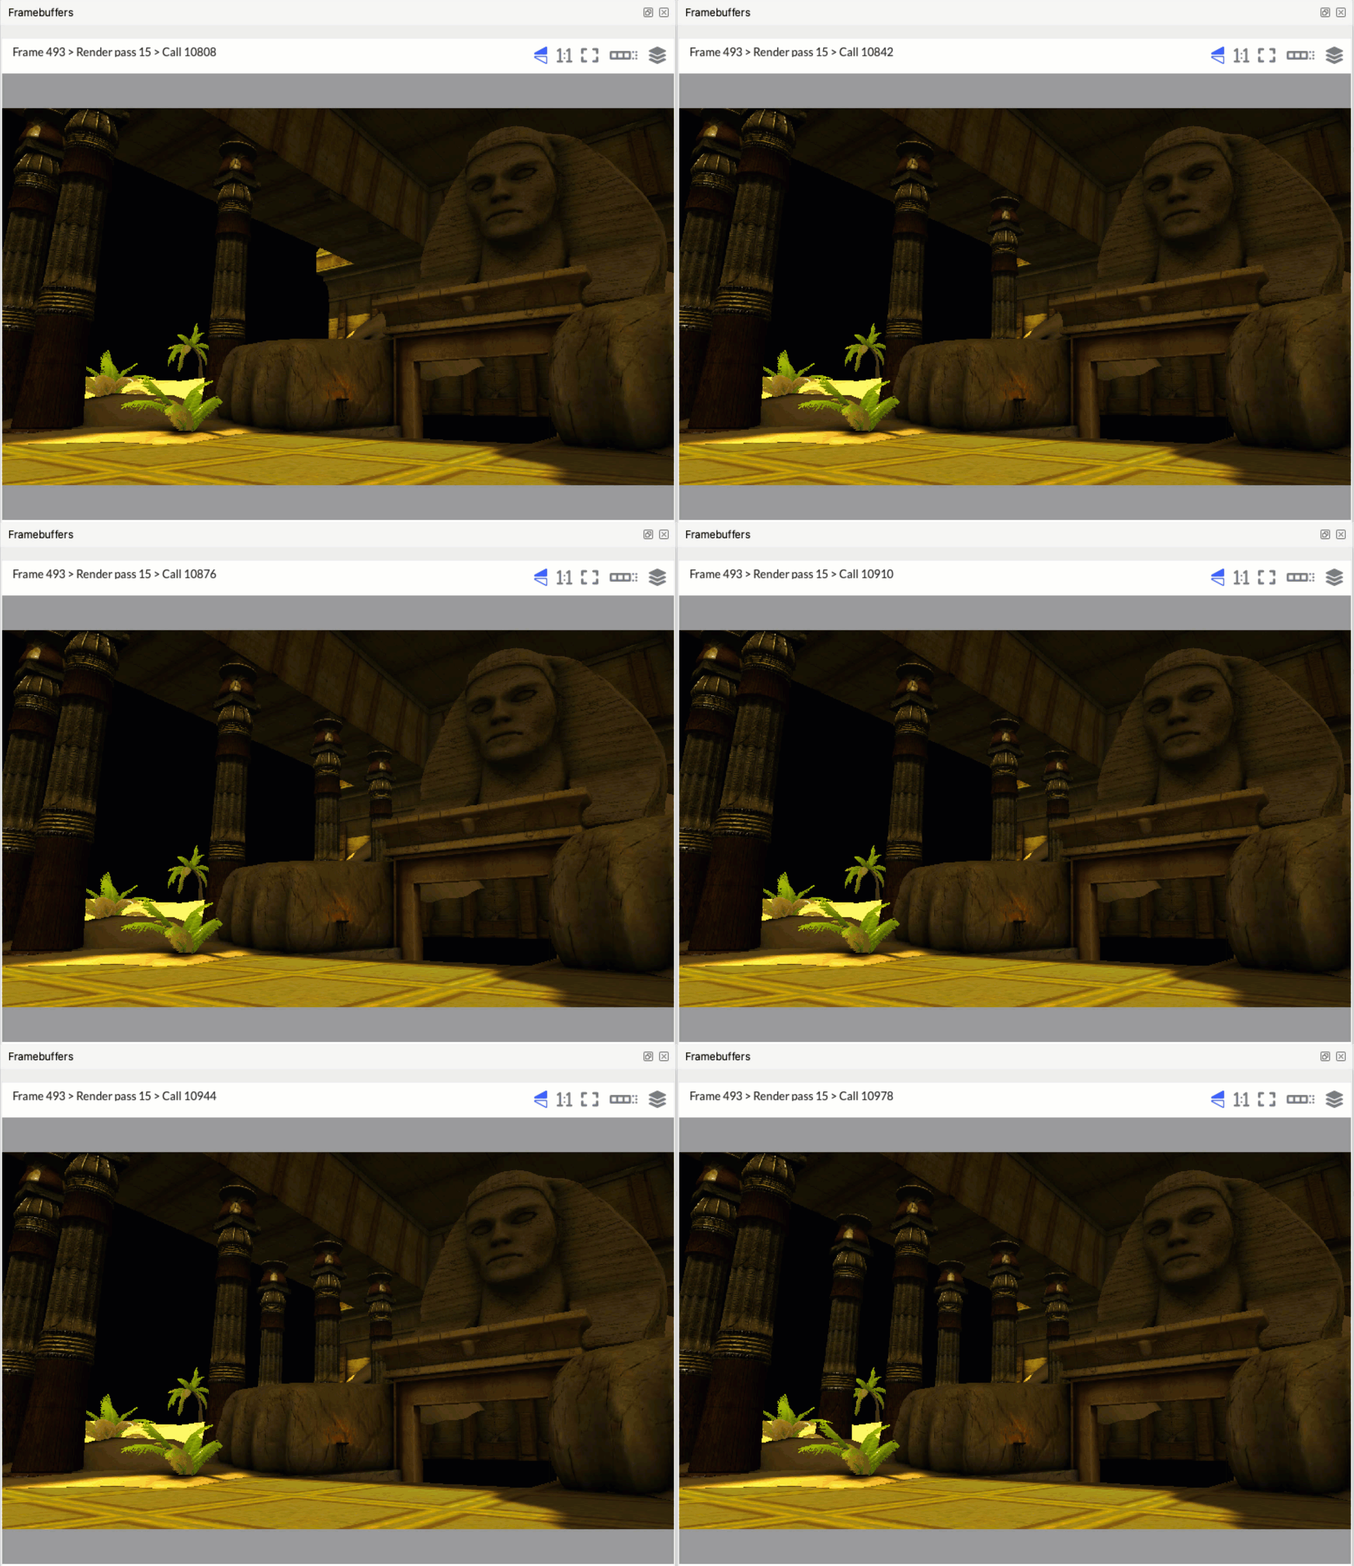 Framebuffers view in Frame Advisor
What you’ve accomplished and what’s next
You’ve inspected draw calls and framebuffer changes for inefficient rendering behavior.
Next, you’ll use the Render Graph to analyze frame construction.