# [Interpret an example Arm Streamline report](https://learn.arm.com/learning-paths/mobile-graphics-and-gaming/ams/streamline_example/)
## In this learning path
- [Introduction](https://learn.arm.com/learning-paths/mobile-graphics-and-gaming/ams/)
- [Set up Arm Performance Studio](https://learn.arm.com/learning-paths/mobile-graphics-and-gaming/ams/ams/)
- [Set up an Android application for profiling](https://learn.arm.com/learning-paths/mobile-graphics-and-gaming/ams/setup_tasks/)
- [Interpret an example Arm Streamline report](https://learn.arm.com/learning-paths/mobile-graphics-and-gaming/ams/streamline_example/)
- [Use Arm Streamline to capture data for your application](https://learn.arm.com/learning-paths/mobile-graphics-and-gaming/ams/streamline/)
- [View an example Performance Advisor report](https://learn.arm.com/learning-paths/mobile-graphics-and-gaming/ams/pa_example/)
- [Create a Performance Advisor report for your application](https://learn.arm.com/learning-paths/mobile-graphics-and-gaming/ams/pa/)
- [Analyze your application with Frame Advisor](https://learn.arm.com/learning-paths/mobile-graphics-and-gaming/ams/fa/)
- [Debug your application with RenderDoc for Arm GPUs](https://learn.arm.com/learning-paths/mobile-graphics-and-gaming/ams/renderdoc/)
- [Analyze shader program performance with Mali Offline Compiler](https://learn.arm.com/learning-paths/mobile-graphics-and-gaming/ams/malioc/)
- [Next Steps](https://learn.arm.com/learning-paths/mobile-graphics-and-gaming/ams/_next-steps/)
## View the example Arm Streamline report
To understand the capabilities of Streamline, use the example Streamline profile that comes with Arm Performance Studio.
1. To open the example profile, in Streamline, select **File** > **Import**.
2. Select **Import Streamline Sample Captures** and click **Next**.
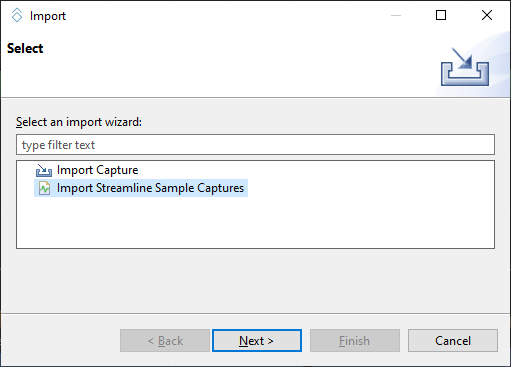
Import Streamline Sample Captures
3. Select the Android example and click **Finish**.
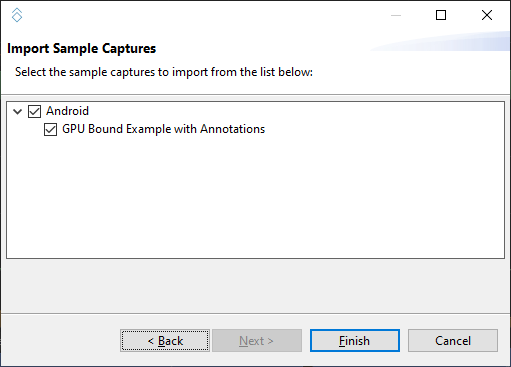
Select sample captures
4. Select the report in **Streamline Data**, then select **Analyze** when prompted. After the report is processed, you’ll see an interactive timeline.
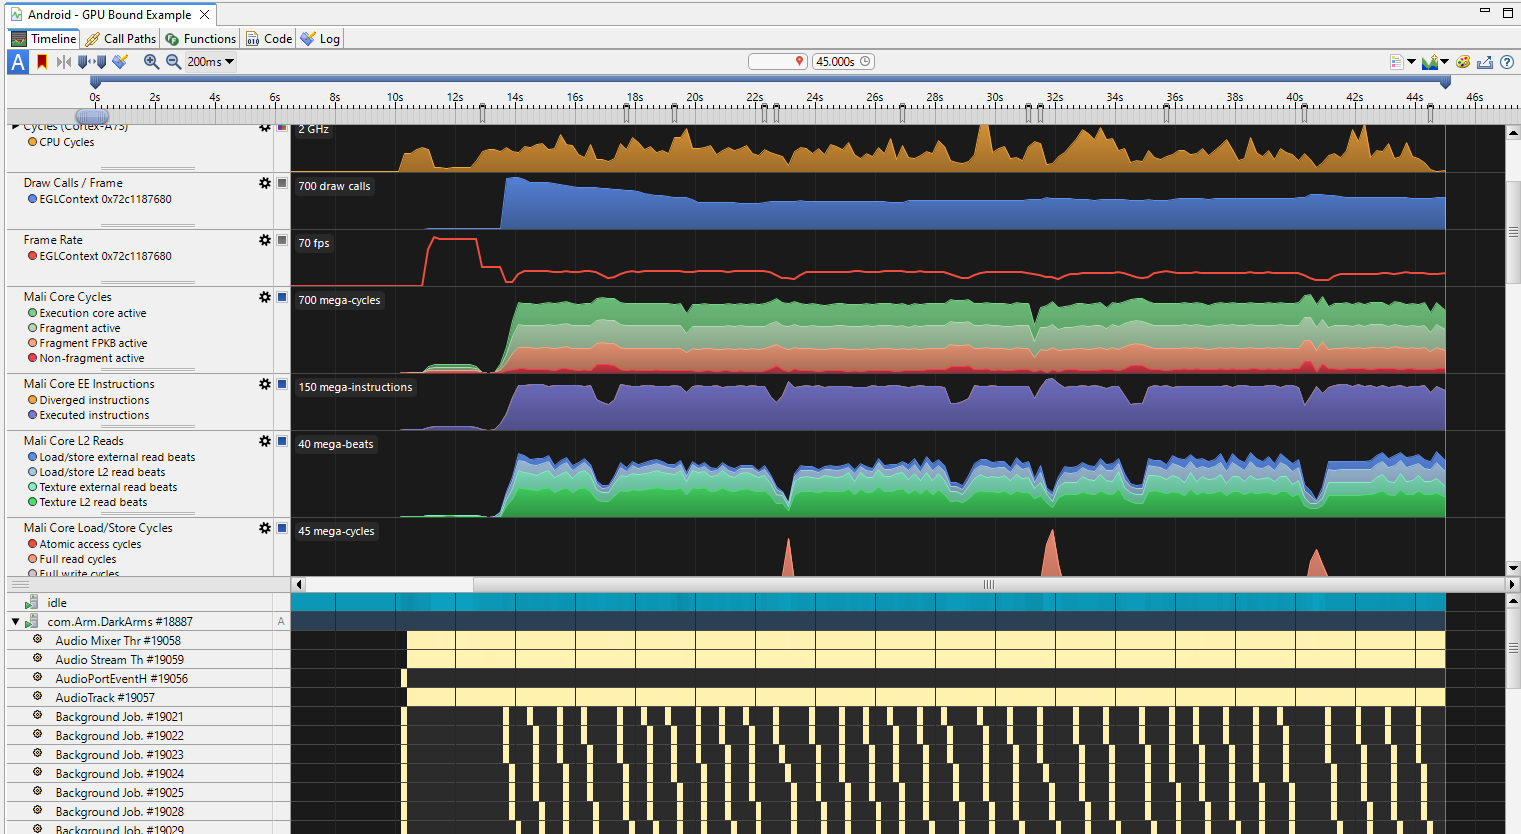
Streamline Timeline
## Analyze the results
The charts in the **Timeline** view show the performance counter activity captured from the device. Hover over the charts to see the values at that point in time. Use the Calipers to focus on particular windows of activity.
For instructions to use the features in the **Timeline** view, see the [Streamline User Guide](https://developer.arm.com/documentation/101816/latest/Analyze-your-capture).
Understanding the output of Streamline is key to the tool’s usefulness. To understand how to interpret the capture from different points of view, see [Android performance triage with Streamline](https://developer.arm.com/documentation/102540/latest/).
## What you’ve accomplished and what’s next
You’ve now viewed an example Arm Streamline report and interpreted the results using Arm documentation.
Next, you’ll use Arm Streamline to capture data for your application.