Profile an Android application with Arm Performance Studio
Introduction
Set up Arm Performance Studio
Set up an Android application for profiling
Interpret an example Arm Streamline report
Use Arm Streamline to capture data for your application
View an example Performance Advisor report
Create a Performance Advisor report for your application
Analyze your application with Frame Advisor
Debug your application with RenderDoc for Arm GPUs
Analyze shader program performance with Mali Offline Compiler
Next Steps
Run RenderDoc for Arm GPUs
RenderDoc for Arm GPUs is an Arm fork of the RenderDoc open-source debugger.
The Arm release includes support for API features and extensions that are available on the latest Arm GPUs, but not yet supported in upstream RenderDoc. Arm intends to contribute changes to the upstream project, but some Arm-specific or Android-specific features might be available only in the Arm fork.
To run RenderDoc for Arm GPUs:
Open RenderDoc for Arm GPUs and select your connected device from the Replay Context dropdown list at the bottom left of the RenderDoc UI.
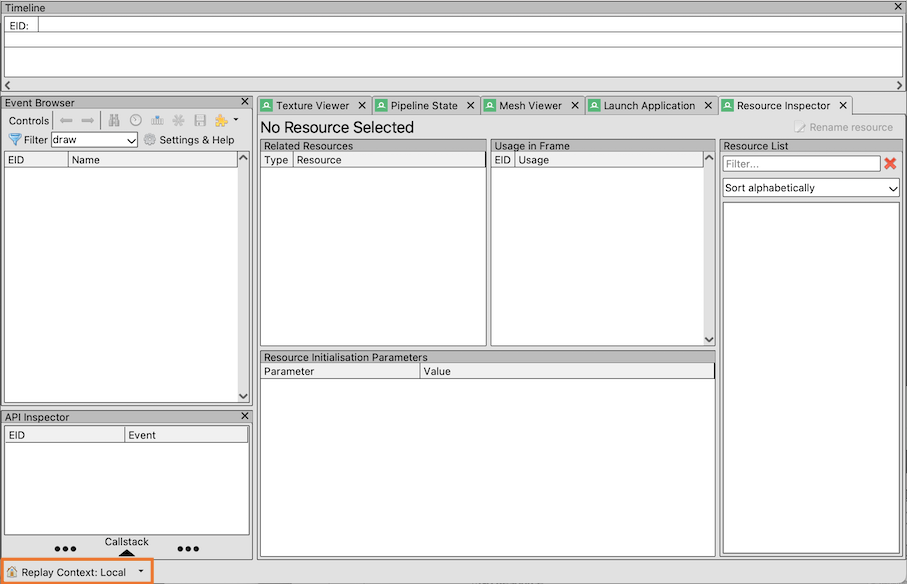
The RenderDoc APK starts running on your target.
If you don’t see your device, check that your device is set up correctly as described in Setup tasks .
Navigate to the Launch Application tab, and set the Executable Path to the application that you want to debug. Select the Browse button to view all of the installed application packages on the target and find the
.exefile.Select Launch, to start the application running on your target. After a successful launch, a new target-specific tab opens in the UI where you can select the frames that you want to capture.
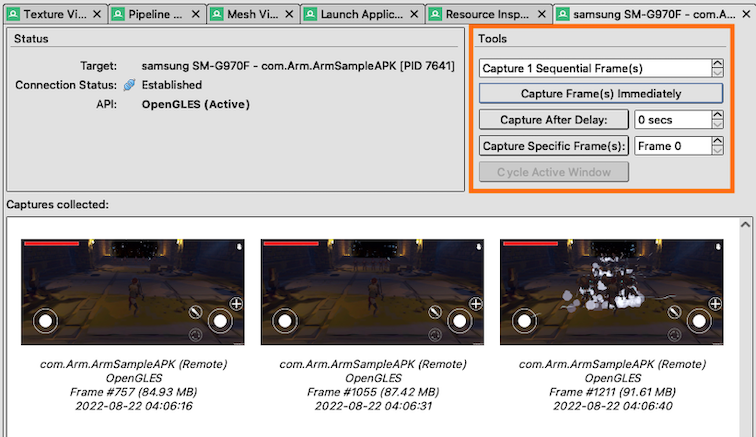
As your application runs, you can choose to:
- Capture one or more frames immediately
- Capture one or more frames after a delay
- Capture one or more frames after a specific frame
Use these controls to take captures of your application as it runs on the target device. Captured frames are stored temporarily on the device.
When you’ve finished capturing the frames of interest, stop the application that you are debugging. Keep RenderDoc running so that you can analyze and debug your captures.
Select a capture from the Captures collected window and select Open. When the frame has loaded, it’s displayed on the target and in the Texture Viewer tab, and the Event Browser is populated.
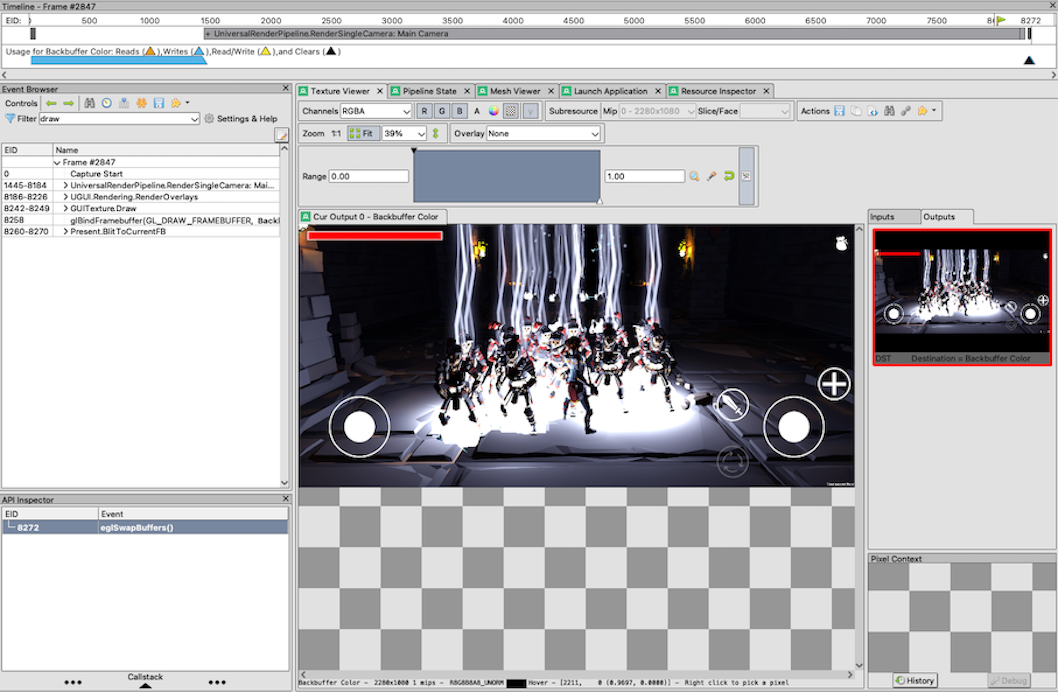
By default, the Event Browser shows all
action()events, which include draws, copies, and clears. Enter a search term in the Filter dropdown to filter these events.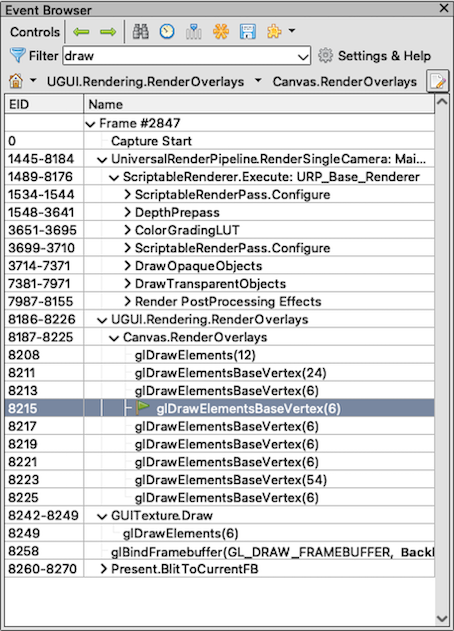
Selected events are highlighted with a green flag. The other windows in the UI update to display information for the selected event, including the render state, data resources, and GPU output.
For a full list of features, see the RenderDoc documentation .
What you’ve accomplished and what’s next
You’ve now run RenderDoc for Arm GPUs on your application and learned how to capture frames and select events for debugging.
Next, you’ll run Mali Offline Compiler to compile shaders and generate performance reports.