ETM Trace
Many Armv7-M/Armv8-M devices include an Embedded Trace Macrocell (ETM) which provides instruction trace. When streaming instruction trace directly to your PC, the µVision debugger enables review of historical sequences , execution profiling , performance optimization , and code coverage analysis .
Types of Problems that can only be found with ETM Trace
There are certain types of problems that can only be found with a quality trace, such as:
- Pointer problems.
- Illegal instructions and data aborts (such as misaligned writes): How I did I get to this fault vector?
- Code overwrites – writes to Flash, unexpected writes to peripheral registers: How did I get here?
- A corrupted stack.
- Out of bounds data. Uninitialized variables and arrays.
- Stack overflows: What causes the stack to grow bigger than it should?
- Probably the most important use: an application has gone off into the weeds and you need to know what instruction caused this.
- Communication protocol and timing issues.
- System timing problems.
- Profile Analysis and Code Coverage is provided. Available only with ETM trace.
FVPs: Configure the Target Driver Setup to use ETM Trace
The Corstone-300 FVP can be used to collect instruction trace data with a two-step approach. First, you run the simulation and collect the data. Then, you restart the simulation and load the coverage file that was created in the first step to use the data in µVision. Follow these steps to set this up in µVision:
- Open a Windows Explorer and copy the file
MTItoCoverage.dllfromC:\Keil_v5\ARM\VHTtoC:\Keil_v5\ARM\FVP\Corstone-300\models\Win64_VC2017. This file is required to extract the coverage data from a previous run. - In µVision, Go to
 Project - Options for Target… (Alt+F7) and switch to the Debug tab.
 - On the right-hand side, select Models ARMv8-M Debugger and click on Settings. The Models ARMv8-M Target Driver Setup window opens.
- Select a coverage file (simply enter a name for the file and it will be generated automatically).
- Enable Load Coverage on Connect and Store Coverage on Disconnect:
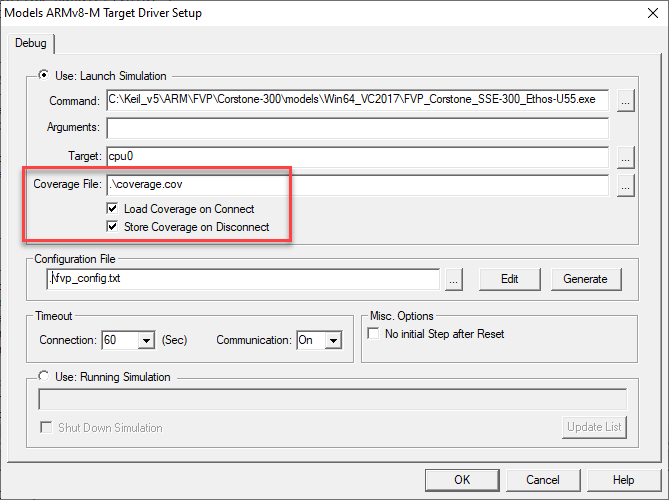
- Click OK twice.
When you now start a debug session, the coverage information is recorded. When you leave the debug session, the data is written to the coverage file specified. Next time you start a debug session, the file is opened and the information is used. This method does not provide Instruction Trace data, so you can move directly to the Code Coverage section.
Hardware: Configure the Target Driver Setup to use ETM Trace
For the following, you need to connect a ULINKpro debug and trace adapter to your target board using the 20-pin Cortex+ETM connector .
- Go to Project - Options for Target… (Alt+F7) and switch to the Debug tab.
- Remove any Initialization File that might be present.
- On the right-hand side, select ULINK Pro Cortex Debugger and click on Settings. The Target Driver Setup window opens.
- Select the Trace tab:
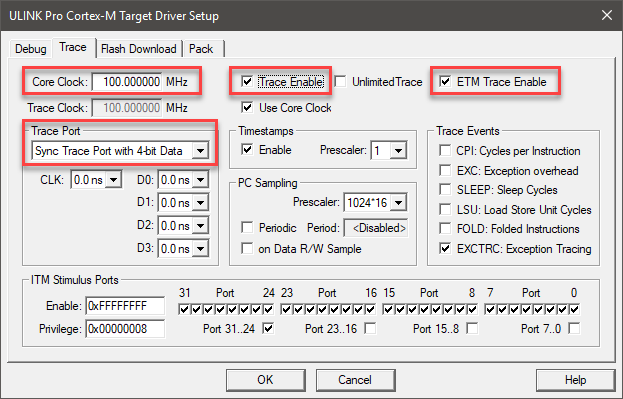
- In Core Clock: enter the correct core clock of your target device. This value will be used for calculating timing values.
- If your device runs a different trace clock, you might need to unselect Use Core Clock and enter the correct trace clock speed.
- Select Trace Enable for SWV data trace.
- Select ETM Trace Enable for ETM.
- Set Trace Port to Sync Trace Port with 4-bit Data.
- The last 1 million trace frames will be saved with the older ones being overwritten. If you need to save them all, select also Unlimited Trace. Your hard drive space will determine how many are saved. ULINKpro is a streaming trace.
- ETM and SWV are now configured and ready to use. Click OK twice to return to the main μVision menu.
Instruction Trace
Instruction trace enables the review of historical data of the application execution.
Open the Trace Data Window and Confirm Trace is Working
- Start a Debug Session (Ctrl+F5) to enter the µVision debugger.
 Go to View - Trace and select Trace Data.
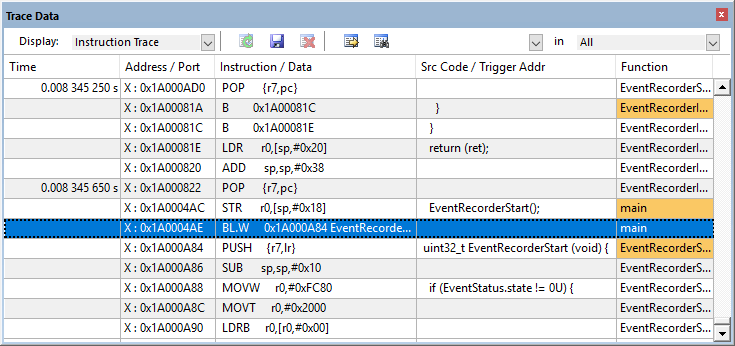
- The Trace Data window will look similar to the one below if it is working correctly:
- If you do not see trace frames in this window, go to View - Trace and select Enable Trace Recording.
- You must stop the program to view the trace frames in the Trace Data window.
- All frames are executed instructions with source if available.
- The Function column displays the name of its function with the first instance highlighted in orange.
View ETM Frames starting at Reset
- Scroll to the top of the Trace Data window to the first frame. This is the first instruction executed after the initial RESET sequence. In this case, it is a
LDRinstruction in the RESET_Handler function as shown below: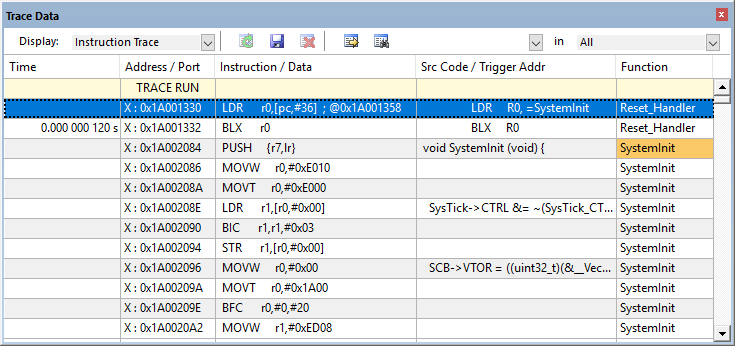
- If you use the Memory window to look at location
0x04, you will find the address of the first instruction there and this will match with that displayed in the first frame. In my case it is0x1A00_1330 + 1 = 0x1A00_1331(+1 says it is a Thumb® instruction ). The first occurrence in a function is highlighted in orange to make the start of functions easier to find. - Any source code associated with an instruction is displayed in the Src Code / Trigger Addr column.
- If you double-click on any line, this will be highlighted in both the Disassembly and the relevant source window.
If you unselect Run to main() in the Debug tab of the Options for Target… window, no instructions will be executed when you enter debug mode. The program counter will be 0x1A00_1330. You can run or single-step from that point and this will be recorded in the Trace Data window.
How to Find Interesting Trace Frames
Capturing all the instructions executed is possible in simulation and with ULINKpro but this might not be practical. It is not easy sorting through millions of trace frames or records looking for the ones you want. Use Trace Filters, Find, or save everything to a file and search with a different application program such as a spreadsheet.
Trace Filters
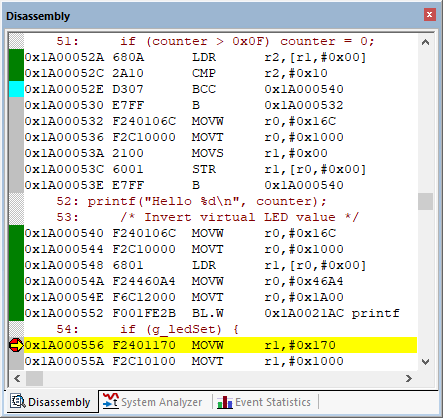
In the Trace Data window, you can select various types of frames to be displayed. The Display: box shows the various options available: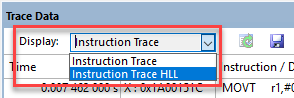
These filters are post collection.
Find a Trace Record
In the Find a Trace Record box, enter bx as shown here: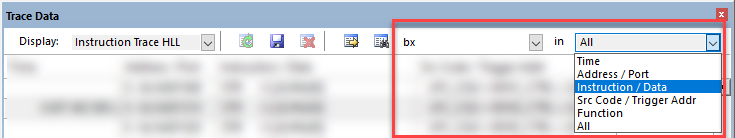
You can select properties/columns where you want to search in the “in” box.
Select the Find a Trace Record icon  and the following screen opens:
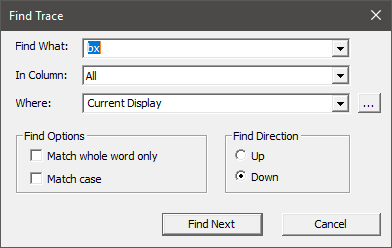
Click on Find Next and each time it will step through the trace records highlighting each occurrence of the instruction bx. Or you can press “Enter” to go to the next occurrence of the search term.
Trace Triggering with Tracepoints
The data stream capture can be controlled and filtered by using tracepoints. μVision has three types of trace trigger commands:
- TraceRun : Starts ETM trace collection when encountered.
- TraceSuspend : Stops ETM trace collection when encountered. ETM tracing must have been started with TraceRun.
- TraceHalt : Stops all trace data, including ETM. Trace collection can be resumed only with a STOP/RUN sequence in the µVision debugger.
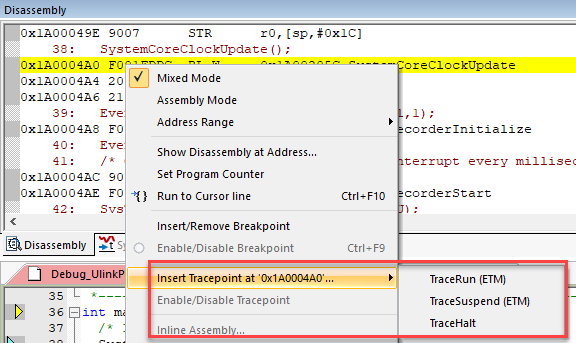
They are selected from the context menu by right-clicking on a valid assembly instruction in the Disassembly window or a C source line:
How it works
When a TraceRun is encountered on an instruction while the program is running, ULINKpro will start collecting trace records. When a TraceSuspend is encountered, trace records collection will stop there. Everything in between these two will be collected. This includes all instructions through any branches, exceptions and interrupts. Sometimes there is some skid past the trigger point which is normal.
Setting Trace Triggers
Setup the current application:
- Stop the program, but stay in debug mode.
- In
Blinky.c, set a breakpoint near line 46:EventStartA(11);.  Run (F5) the application. Once it hits the breakpoint, it stops.
- Remove the breakpoint.
 Step (F11) once to enter the function
 EventRecord2.
Setup the Trace Triggers:
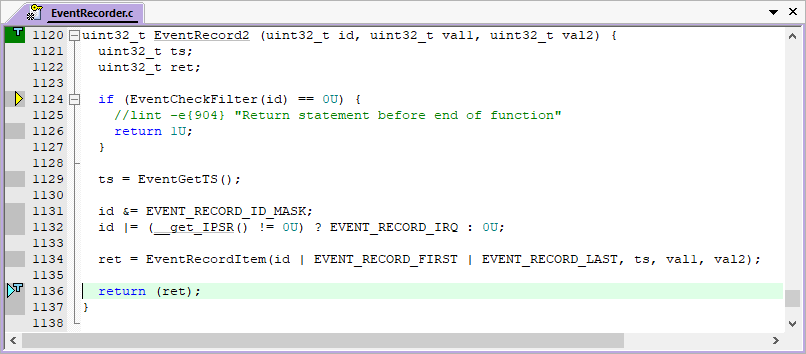
- In the file
EventRecorder.c, right click on the grey (or green) block opposite near line 1120. - Select Insert Tracepoint at or near line 1120 and select TraceRun (ETM). A cyan T will appear next to that line.
- Right-click on the gray (or green) block opposite line 1136
return ret;. - Select Insert Tracepoint at line 1136 and select TraceSuspend (ETM). A cyan T will appear:
- Clear the Trace Data window for convenience. This is an optional step.
- Run (F5) the application and after a few seconds click
 Stop.
Stop. - Filter exceptions out by selecting ETM – Code Exec in the Display: in the Trace Data window:
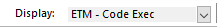
- Examine the Trace Data window:
- In the
Command
window, enter
TLand press “Enter” to display the two tracepoints:
- Enter
TK*in the Command window and press “Enter” to delete all tracepoints.
Trace Skid
The trace triggers use the same CoreSight hardware as the Watchpoints . This means that it is possible a program counter skid might happen. The program might not start or stop on the exact location you set the trigger to. You might have to adjust the trigger point location to minimize this effect. This is because of the nature of the comparators in the CoreSight module and it is normal behavior.
Code Coverage
Code Coverage tells what assembly instructions were executed. It is important to ensure all assembly code produced by the compiler is executed and tested. You do not want a bug or an unplanned circumstance to cause a sequence of untested instructions to be executed. The result could be catastrophic. Functional safety applications require Code Coverage for certification.
The µVision debugger provides Code Coverage with the FVP or via ETM using ULINKpro.
 Start a Debug Session (Ctrl+F5) to enter the µVision debugger.
- In Blinky.c, set a breakpoint at
if (g_ledSet) {(near line 56). - Run (F5) the application. Once it hits the breakpoint, it stops. Remove the breakpoint.
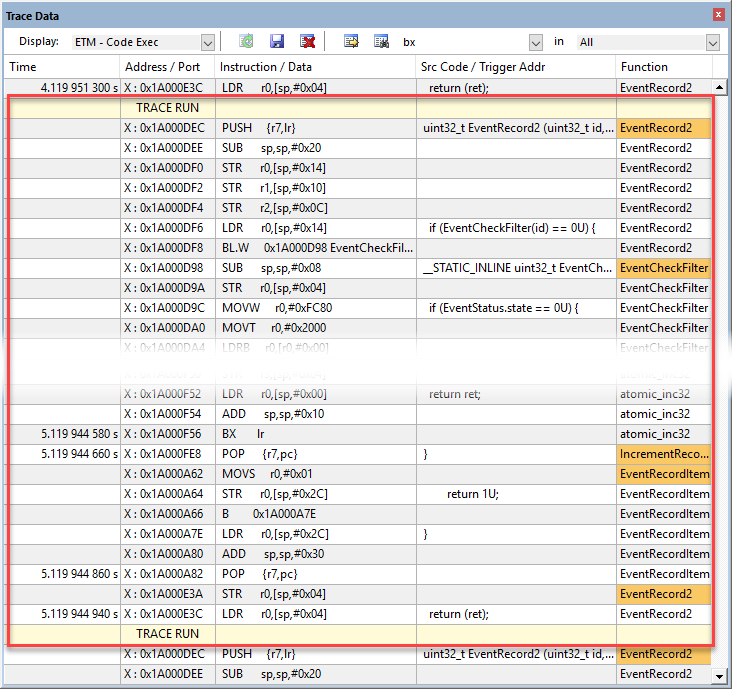
- Examine the Disassembly and Blinky.c windows. Scroll and notice the different color blocks in the left margin:
This is Code Coverage provided by ETM trace. This indicates if an instruction has been executed or not.
Color blocks indicate which assembly instructions have been executed:
 There is no assembly instruction here.
 This assembly instruction was not executed.
 This assembly instruction was executed.
 A Branch is never taken.
 A Branch is always taken.
 A Breakpoint is set here.
 This points to the next instruction to be executed.
Code Coverage is visible in both the Disassembly and source code windows. Click on a line in one window and this place will be matched in the other window.
Code Coverage Window
A separate Code Coverage window is available that shows statistics.
 Go to View - Analysis Windows and select Code Coverage:
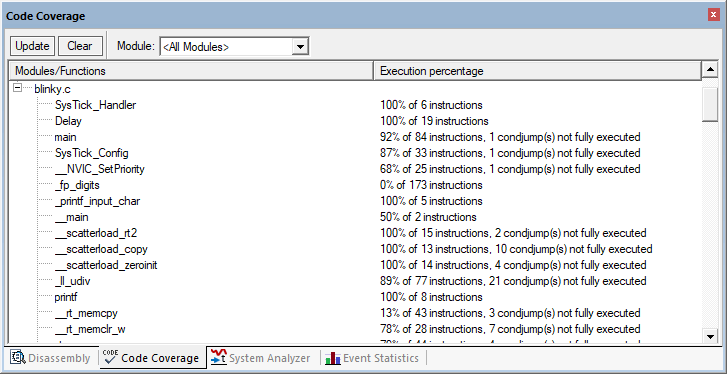
Code Coverage Data in the Command Window
In the
Command
window, you can show Code Coverage in many ways, for example, enter coverage \Blinky.c\main details: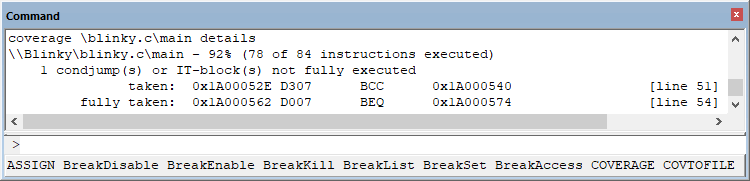
You can copy and paste the result from the Command window by right-clicking into it. Save the data in a convenient format.
Save Code Coverage Data
Code Coverage information is temporarily saved during a run and is displayed in various windows as shown. It is possible to save this information in an ASCII file for use in other programs. You can save Code Coverage data in two formats:
- In a
.gcov
file. In the Command window execute:
COVERAGE GCOV moduleCOVERAGE GCOV * - In an ASCII file using the
logcommand.
Send Code Coverage data to a file (the specified directory must exist):log > c:\cc\test.txtlog(you can also specify a module or function):coverage asmlog off
Performance Analysis
It is useful to optimize your code for speed. Performance Analyzer tells you how much time was spent in each function as well as the total number of total calls. A graphical display is generated for a quick reference. If you are optimizing for speed, work first on those functions taking the longest time to execute.
The µVision debugger provides Performance Analysis with the FVP (number of calls only) or via ETM using ULINKpro.
- Start a Debug Session (Ctrl+F5) to enter the µVision debugger.
 Go to View - Analysis Windows and select Performance Analysis:
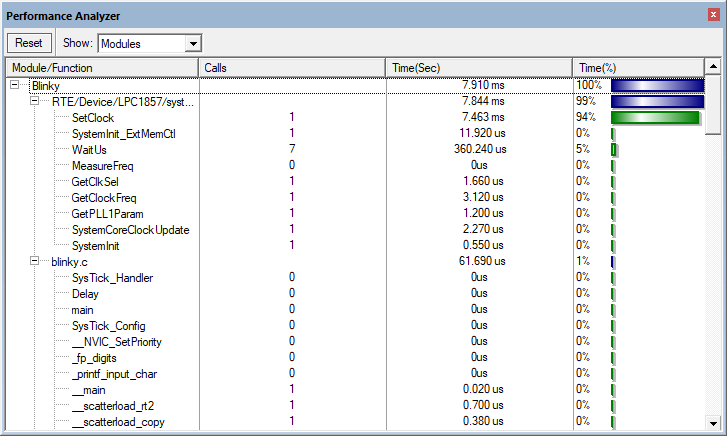
- Do not click on Run (F5) yet!
- Expand some of the module names as shown above.
- Shown is the number of calls and percentage of total time in this short run from reset to the start of
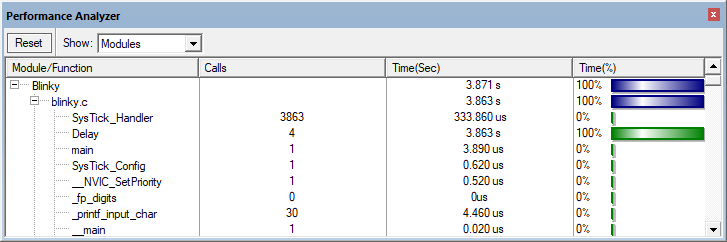
main(). - Now, Run (F5) the application. The Performance Analyzer window updates in real-time:
- Double-click on any Function or Module name and this will be highlighted in the Disassembly or source code windows.
- Select Show: Functions from the pull down box and notice the difference.
- You can reset the Performance Analyzer window by clicking on
 . Watch as new data is displayed in the window.
Execution Profiling
Execution Profiling is used to display how much time a C source line took to execute and how many times it was called. This information is provided by the ETM trace in real time while the program keeps running.
The µVision debugger provides Execution Profiling with the FVP (number of calls only) or via ETM using ULINKpro.
- Start a Debug Session (Ctrl+F5) to enter the µVision debugger.
- Go to Debug - Execution Profiling and select Show Time.
- Run (F5) the application.
- In the left margin of the Disassembly and source code windows various time values will be displayed.
- Hover the cursor over a time and more information appears as in the yellow box here:
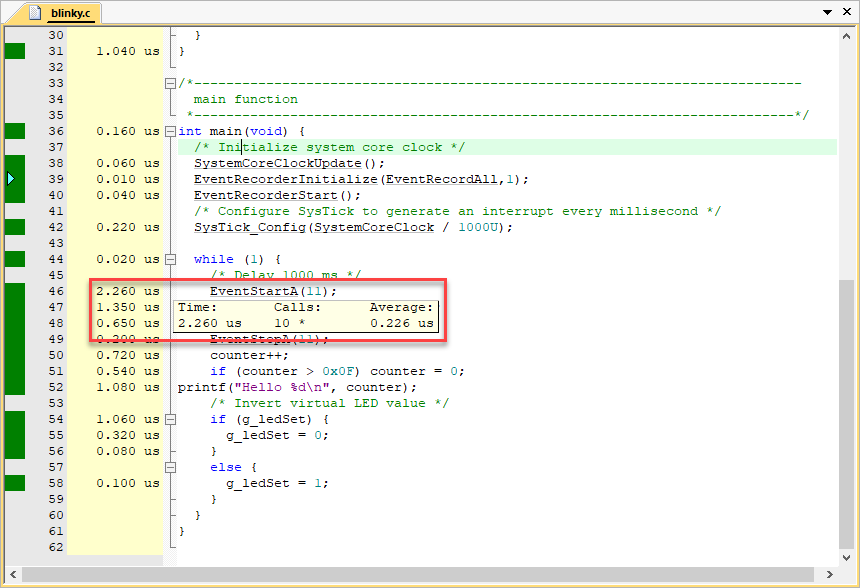
- You can also select Debug - Execution Profiling - Show Calls to display this information rather than the execution times in the left margin.
Outlining
At some places, there is an  Outlining sign that can be used to collapse a code section and to compress the associated source files together.
- In
Blinky.c, click in the Outlining square near thewhile (1) {loop near line 46: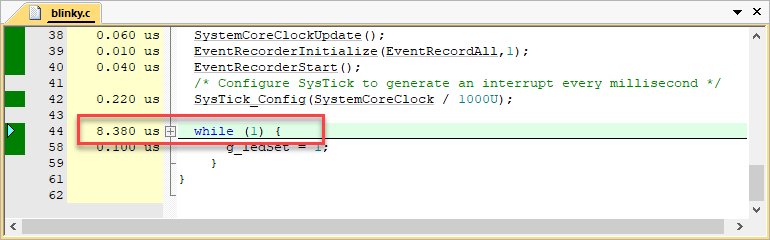
- The C source in the while loop is now collapsed into one line and times are added together to 8.380 us in this case.
- Click on
 to expand it.
Outlining can be useful to hide sections of code to simplify the window you are reading.
In-the-Weeds Example
This part of the tutorial requires real hardware with ETM trace capabilities as the Traca Data window is not available for FVP models.
Some of the hardest problems to solve are those when a crash has occurred and you have no clue what caused this – you only know that it happened and the stack is corrupted or provides no useful clues.
Modern programs tend to be asynchronous with interrupts and RTOS thread switching plus unexpected and spurious events. Having a recording of the program flow is useful especially when a problem occurs and the consequences are not immediately visible. Another problem is detecting race conditions and determining how to fix them. ETM trace handles these problems and others easily and it is easy to use.
In this example, a hard fault occurs and the CPU ends up at 0x1A00_133A as shown in the Disassembly window (note that your address might not be the same as shown here):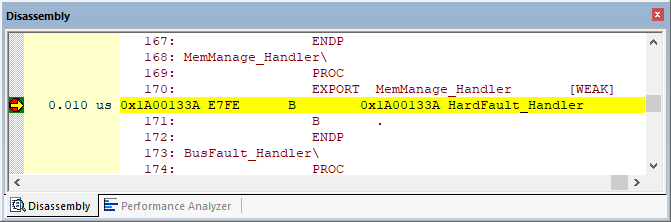
This is the HardFault_Handler. This is a branch to itself and will run this instruction forever. The trace buffer will save millions of the same branch instructions, which is not very useful.
The hard fault handler exception vector is found in the startup file of your device. Set a breakpoint by clicking on the HardFault_Handler and run the program. At the next hard fault event, the CPU jumps to the HardFault_Handler and halts processing. The difference this time is the breakpoint will stop the CPU and also the trace collection. The trace buffer will be visible and is useful to investigate and determine the cause of the crash.
Simulate a Hard Fault
- Using the previous example, start a Debug Session (Ctrl+F5) to enter the µVision debugger.
- Locate the
HardFault_Handlerin the startup_device.s/c file. - Set a breakpoint at this point. A red circle will appear.
- In the Command window execute:
g, EventRecord2EventRecord2returns with aPOPinstruction which you will use to create a hard fault withLR = 0. The assembly and sources in the Disassembly window do not always match up and this is caused by anomalies in ELF/DWARF specification. In general, scroll downwards in this window to provide the best match. - Clear the Trace Data window by clicking on the
 clear trace icon. This helps to see what is happening.
 - In the Register window, double-click on the
R14 (LR)register and set it to'0'. This will cause a hard fault when the processor placesLR = 0into the PC and tries to execute the non-existent instruction at memory location0x0. - Run (F5) the application and almost immediately it will stop on the hard fault exception branch instruction.
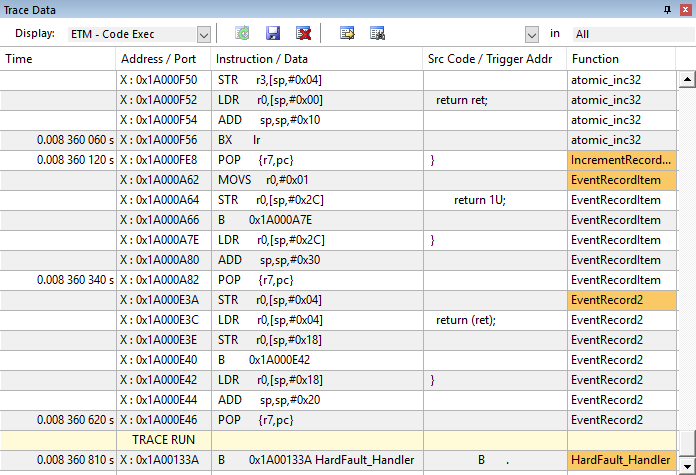
- In the Trace Data window, you will find the
EventRecord2function with thePOPinstruction at the end. When the function tried to return, the bogus value of LR caused a hard fault. - The
Binstruction at the hard fault vector was not executed because CoreSight hardware breakpoints do not execute the instruction they are set to when they stop the program. They are no-skid breakpoints. - Step (F11) once. You will now see the hard fault branch as shown in the bottom screen:
This example clearly shows how quickly ETM trace can help debug program flow bugs.
Instead of setting a breakpoint on the hard fault vector, you could also right-click on it and select Insert Tracepoint and select TraceHalt. When hard fault is reached, trace collection will halt but the program will keep executing for testing and hard fault handlers.