Build an RTX5 RTOS application with Keil μVision
Introduction
Create and setup Keil MDK project
Initialize the operating system
Create RTOS threads
Build and run the application
Using Event Recorder
Next Steps
Build an RTX5 RTOS application with Keil μVision
We saw in the last section that Keil MDK does not support semihosting.
CMSIS-View provides Event Recorder which can be used instead for the printf functionality. It’s supported for both FVPs and real hardware.
Event Recorder and Component Viewer are not supported. This section can be ignored.
Manage run-time environment
Open the Manage run-time environment dialog, and enable CMSIS-View > Event Recorder (DAP variant).
Enable CMSIS-Compiler > STDOUT (API), and set to Event recorder. You’ll also need to enable CMSIS-Compiler > Core.
Click OK to save.
Add Event Recorder to main
Add a function call to initialize the event recorder. Open main.c in the editor.
Include the header file:
#include "EventRecorder.h"
Add this function call to main(), before osKernelInitialize():
EventRecorderInitialize (EventRecordAll, 1); // initialize and start Event Recorder
Set the Event Recorder timing source
Navigate the project tree to locate CMSIS-View > EventRecorderConf.h, and open this file.
Click the Configuration Wizard tab.
Set Event Recorder > Time Stamp Source to CMSIS-RTOS2 System Timer, and save the file.
This change will be reflected in the source code as:
#define EVENT_TIMESTAMP_SOURCE 2
Define the Event Recorder buffer
EventRecorder.o will use a buffer to store the generated data. This must be located in an uninitialized region of writable memory.
Edit the scatter file, creating a new execution region (after ARM_LIB_STACK):
EVENT_BUFFER 0x20060000 UNINIT 0x10000 {EventRecorder.o (+ZI)}
If you get a link-time warning:
Warning: L6314W: No section matches pattern EventRecorder.o(ZI).
Verify that Link-time optimization was disabled in C/C++ (AC6) tab in the Target Options dialog.
Build and run the example
Save all files, and build (F7) the example.
Click Debug (Ctrl+F5), then Run (F5) to start the application.
The thread output is now displayed in the printf viewer:
hello from thread 1
hello from thread 2
hello from thread 3
hello from thread 1
hello from thread 2
...
Event recorder view
Use the menu (View > Analysis Windows > Event Recorder) to open the viewer.
Note that the RTX source contains many Event Recorder annotations.
For ease of readability, click the Filter icon to hide these events. Ensure STDIO events are enabled.
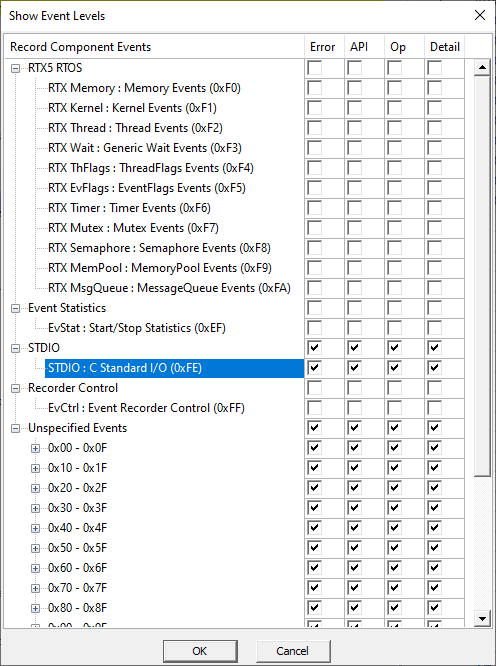 Event Viewer filter settings
Observe that printf output is in the form of the ASCII codes of the text output.
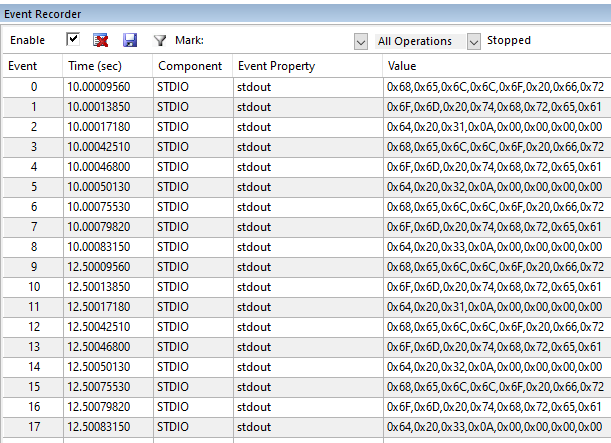 Event Viewer showing ASCII output
For this view it’s better to use EventRecorder Data rather than printf statements.
EventRecorder Data
Edit the threads.c file, and include the header file:
#include "EventRecorder.h"
Add a call in each thread to EventRecord2() with the thread number as the second parameter.
For example, to output a 2 for thread2, use:
void __attribute__((noreturn)) thread2(void *argument){
	for(;;){
		printf("hello from thread2\n");
		osDelay(1000);
		EventRecord2 (1+EventLevelAPI, 2, 0);
	}
}
Save all files, and rebuild (F7) the example.
Click Debug (Ctrl+F5), then Run (F5) to start the application.
Observe the events in the Event Recorder viewer.
Use the filter to hide STDIO events, which shall remove the printf strings. Ensure Unspecified Events > 0x0 is enabled.
The thread number is output as the first Value:
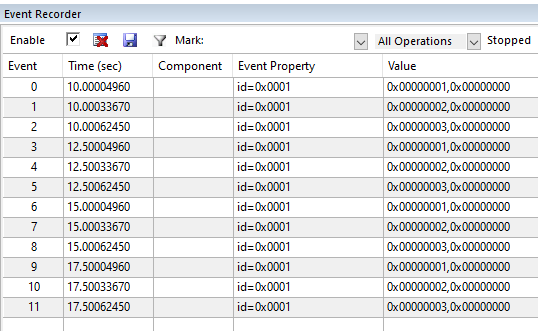 Event Viewer showing thread data values
Component Viewer
To make these events more meaningful in the Event Recorder viewer, use the Component Viewer functionality.
In a text editor, create a
Component Viewer Description File
(e.g. rtos.scvd) with the following:
<?xml version="1.0" encoding="utf-8"?>

<component_viewer schemaVersion="0.1" xmlns:xs="http://www.w3.org/2001/XMLSchema-instance" xs:noNamespaceSchemaLocation="Component_Viewer.xsd">
  <component name="MyExample" version="1.0.0"/>    <!-- name and version of the component  -->

    <events>
      <group name="My Events Group">
         <component name="EVR_Demo" brief="RTOS_Example" no="0x00" prefix="EvrNetMM_" info="Demo"/>
      </group>

      <event id="1" level="API" property="Logging" value="goodbye from thread %d[val1]" info="Example output"  />
	  </events>

</component_viewer>
Exit the debugger, and return to Target Options > Debug, and click Manage Component Viewer Description Files.
Click Add Component Viewer Description File, and browse for the above. Save the settings.
Click Debug (Ctrl+F5), then Run (F5) to start the application.
This file has now defined event 0x0, and this is reflected in the filter view:
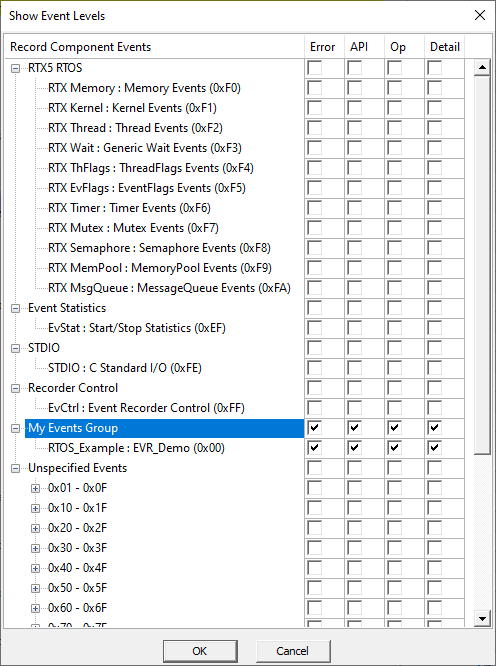 Event Viewer filter with custom component
These events are now processed into meaningful messages in the Event Recorder viewer:
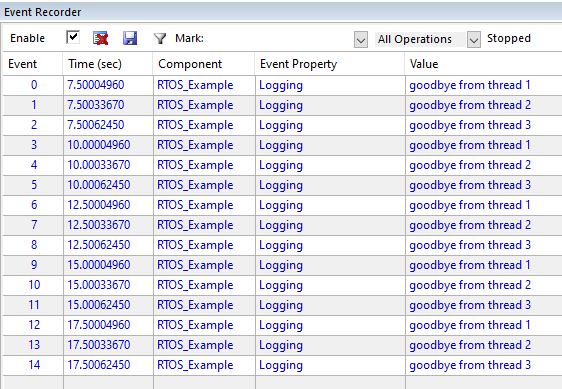 Event Viewer with Component Viewer decoded messages