Build an RTX5 RTOS application with Keil μVision
Introduction
Create and setup Keil MDK project
Initialize the operating system
Create RTOS threads
Build and run the application
Using Event Recorder
Next Steps
Build an RTX5 RTOS application with Keil μVision
You are now ready to build and run the application.
The method and capabilities of Keil MDK and Arm Development Studio are quite different. Refer to the appropriate section below.
Build and run the example (Keil MDK)
Save all files, and click build (F7) the example.
Click Debug (Ctrl+F5) to launch the FVP, and put the IDE into debug mode.
- Use the menu (
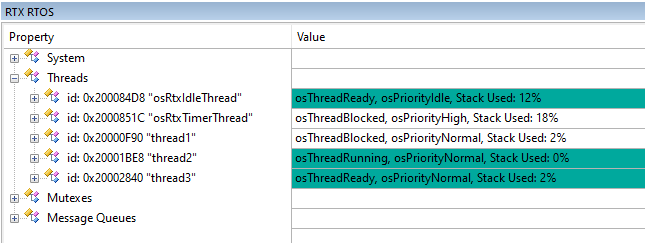
View>Watch Windows>RTX RTOS) to observe the RTOS features. - Use the menu (
View>Serial Windows>Debug (printf)) to observe the printf output.
Click Run (F5) to start the application, and after a short time, click Stop.
Observe in the RTX RTOS view that the threads have been created. Two other threads, osRtxIdleThread and osRtxTimerThread will also be created.
However no output is seen in the printf viewer. This is because semihosting is not supported. You will learn how to address this in the next section.
Exit the debug session (Ctrl+F5).
Build and run the example (Arm Development Studio)
Save all files, then right-click on the project, and select Build Project.
A .axf file will be generated in the Configuration Name folder.
You must now create a Debug Configuration:
- Navigate the menu to
File>New>Model Connection. - Create a Debug connection, and associate it with your project.
- Select the
MPS2_Cortex-M4from the selection of FVPs Installed with Arm DS. - In the Debug configuration view:
- In
Filestab, browse for your.axfimage. - In
Debuggertab, selectDebug from symbol (main) - In
OS Awarenesstab, selectKeil CMSIS-RTOS RTXfrom the pull-down. - Click
Applyto save all settings, then clickDebug.- Subsequent debug sessions can be invoked directly from the
Debug Controlpane.
- Subsequent debug sessions can be invoked directly from the
- In
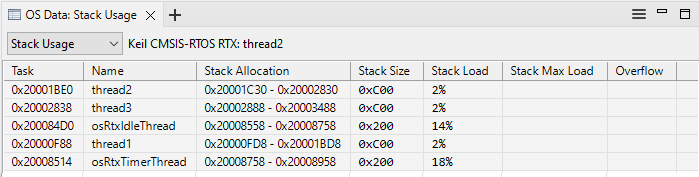
When debugging, use the OS Data view to observe RTOS information. Open from the Window > Show View menu. Use the pull down to select different categories.
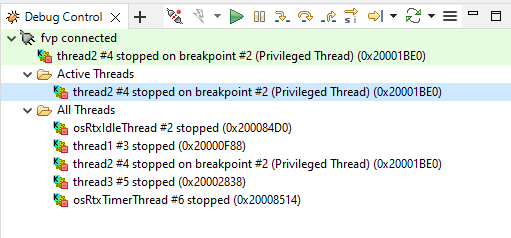
For thread aware debug, right-click on the debug connection in the Debug Control view, and select Display threads.
You will see the printf() output in Target Console pane.
hello from thread 1
hello from thread 2
hello from thread 3
hello from thread 1
hello from thread 2
...