Get started with the Windows Performance Analyzer (WPA) plugin for WindowsPerf
Introduction
Visualize data from WindowsPerf using WPA
Next Steps
Get started with the Windows Performance Analyzer (WPA) plugin for WindowsPerf
Before you begin
The Windows Performance Analyzer (WPA) plugin connects WindowsPerf to the Windows Performance Analyzer.
Before trying WPA with the WPA plugin, you need to install the following software on your Windows on Arm computer:
The WPA plugin install guide includes the installation of WPA.
Using WindowsPerf data in WPA
In order to use WPA with WindowsPerf, you need to create a .json file which is created from a WindowsPerf wperf stat command running on a Windows on Arm machine.
You can save a .json output from WindowsPerf by using the --output command followed by the filename.
Create a
.jsonfileTo create a file named
example.json, run the following command:wperf stat -e ld_spec --timeout 5 --json --output example.jsonNote: This command won’t finish automatically. You can use Ctrl+C to terminate it after it has run for 5-10 seconds.
Open Windows Performance Analyzer, and see the following window:
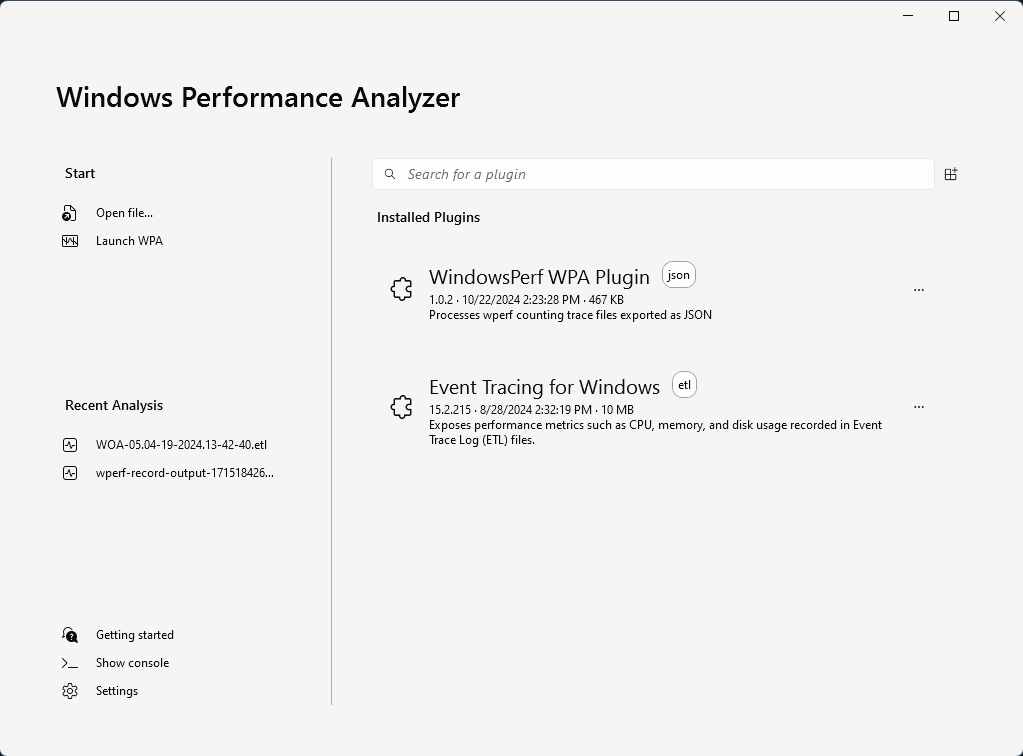
Confirm the
WindowsPerf WPA Pluginappears under the Installed Plugins section.Open the
.jsonfileClick “Open file…” from the start menu on the left side and select the
example.jsonfile.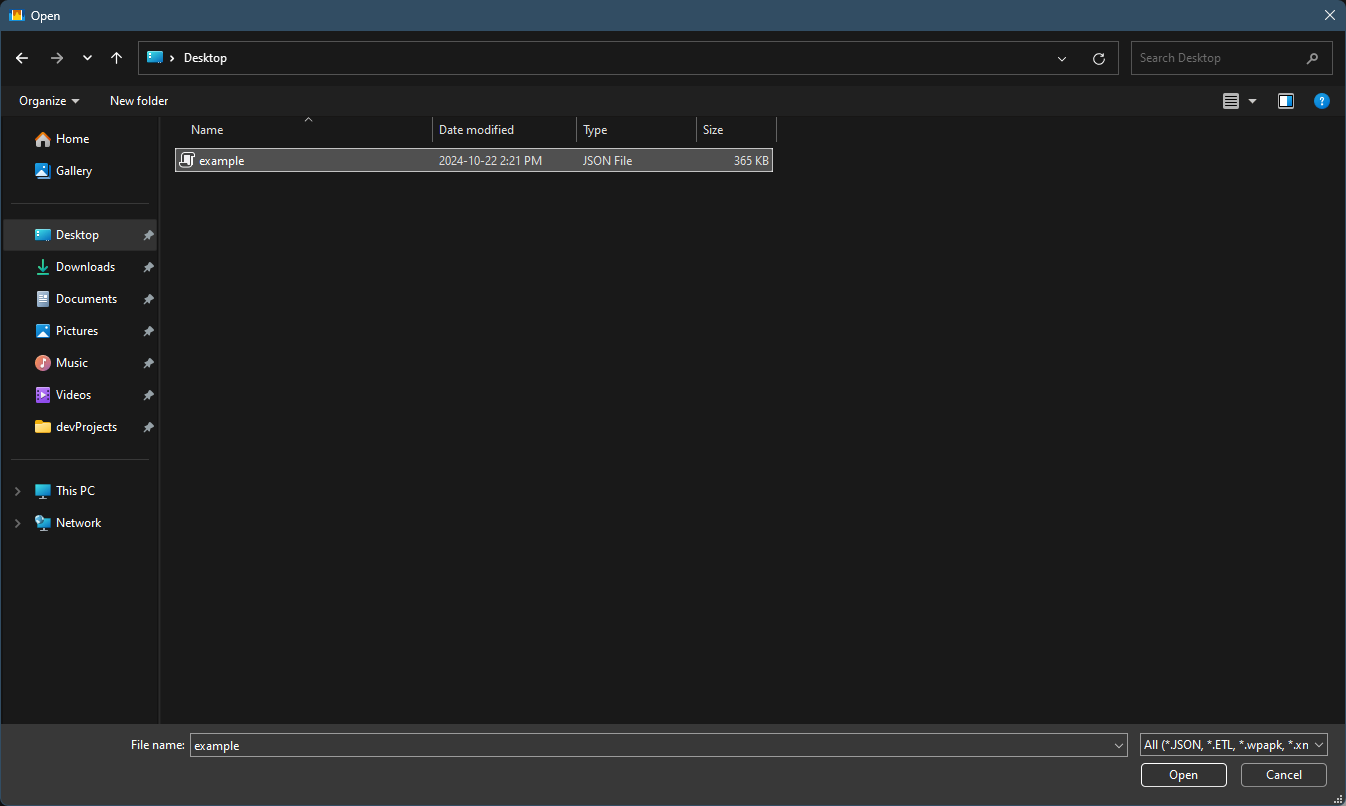
When you click
Open, the output file is checked for compatibility with the WPA plugin, and the main WPA window opens up.
Timeline
The WindowsPerf timeline feature (command line option -t) enables continuous counting of Performance Monitoring Unit (PMU) events.
You can specify sleep intervals (with -i) between counts and set the number of repetitions (with -n), allowing for detailed and flexible data collection.
You can use WPA to visualize PMU events in the recorded data.
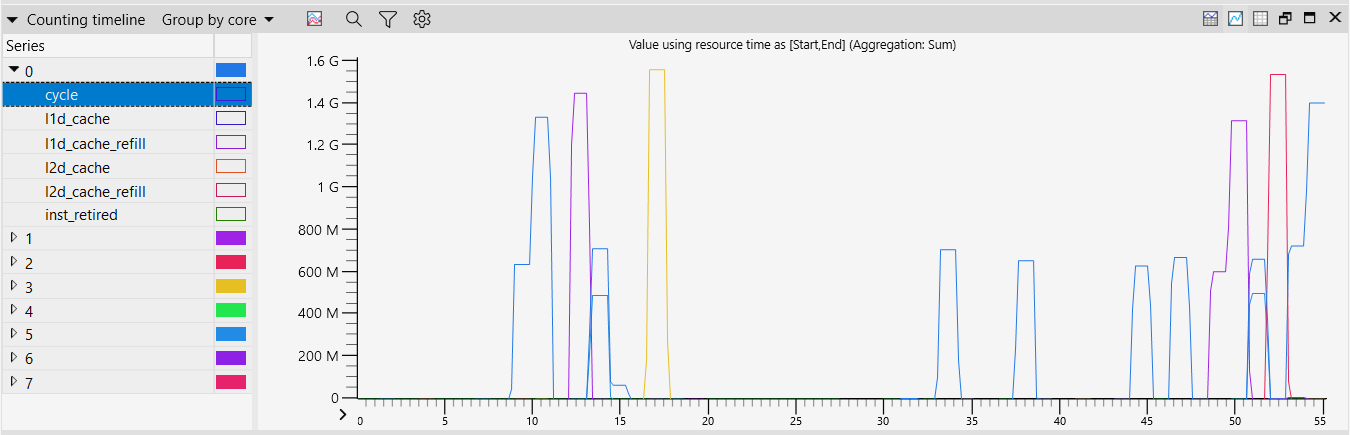
To try the timeline feature, run the command:
wperf stat -m dcache -c 0,1,2,3,4,5,6,7 -t -i 0 -n 10 --timeout 2 --json --output example2.json
Note: above command will run for ~20 seconds.
Open the generated output (.json file) in WPA to see the graph:
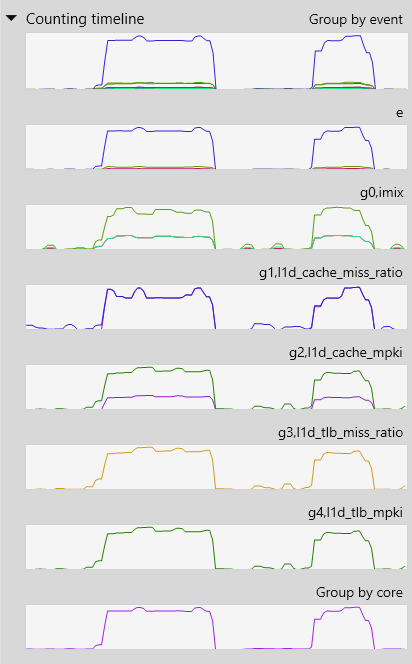
You can change the default grouping from Group by core to Group by event and see the following graph:
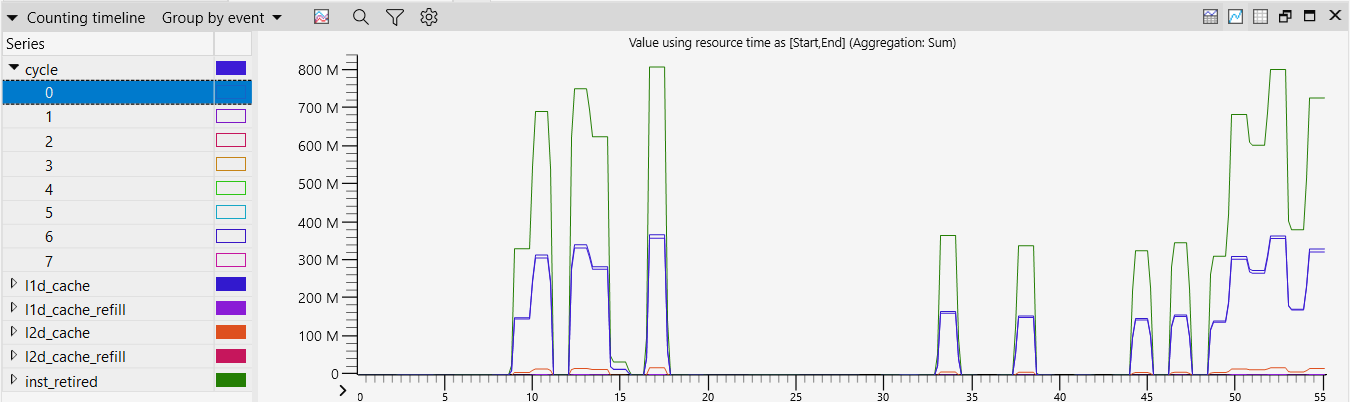
The WPA plugin also generates a graph per event note in order to provide a more in-depth grouping of events.
To see all the generated graphs you can expand the Counting timeline section in the graph explorer section of WPA.
Before you run another wperf command with different options, you use use wperf -list to find out supported metrics in your machine.
wperf stat -t -i 0 -n 10 -m imix,l1d_cache_miss_ratio,l1d_cache_mpki,l1d_tlb_miss_ratio,l1d_tlb_mpki -e inst_spec,vfp_spec,ld_spec,st_spec -c 1 --timeout 2 --json --output example3.json
Note: above command will run for ~20 seconds.
The graph after opening the .json file is shown below:
You can double click on any graph to expand it under the Analysis tab for further data visualization.
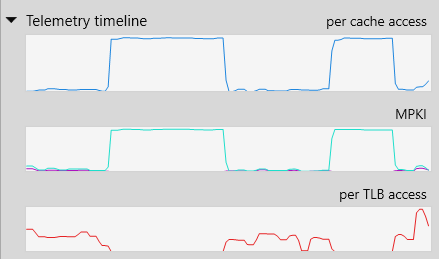
Telemetry
The WPA Plugin also provides visualization of Arm telemetry metrics .
To visualize telemetry, run the following command:
wperf stat -t -i 0 -n 10 -m imix,l1d_cache_miss_ratio,l1d_cache_mpki,l1d_tlb_miss_ratio,l1d_tlb_mpki -e inst_spec,vfp_spec,ld_spec,st_spec -c 1 --timeout 2 --json --output example4.json
Note: above command will run for ~20 seconds.
You can also see the telemetry timeline graphs under the graph explorer level in WPA.
These graphs are generated dynamically so only the relevant metrics for the given .json output file are visible.
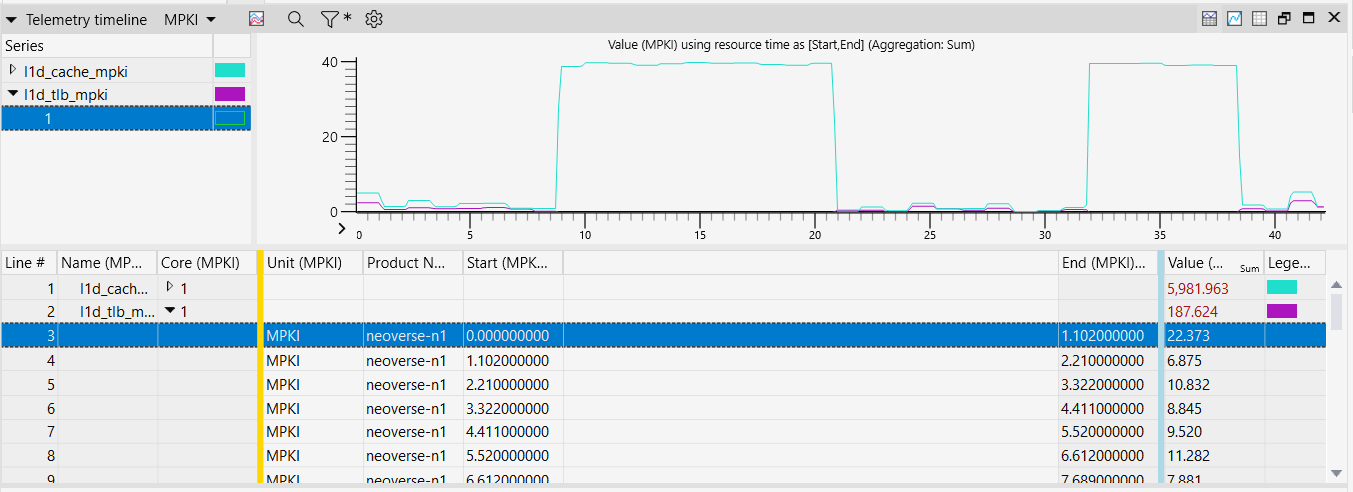
Once expanded, a more in-depth view is visible under the Analysis tab of WPA.
You now have a basic understanding of how to use wperf generated data in the Windows Performance Analyzer.