Build Zephyr projects with Workbench for Zephyr in VS Code
Introduction
Set up your environment
Build a Zephyr application with Zephyr workbench
Analyze and debug a Zephyr application
Next Steps
Build Zephyr projects with Workbench for Zephyr in VS Code
Overview
In this section, you’ll learn how to inspect memory usage and perform live debugging on your Zephyr applications using Workbench for Zephyr. These capabilities are essential for diagnosing bugs and optimizing embedded firmware performance on Arm Cortex-M platforms.
Analyze memory usage
Understanding how your application uses memory is crucial for optimizing embedded firmware on resource-constrained Arm Cortex-M systems. Workbench for Zephyr provides built-in tools to generate detailed memory usage reports after a successful build, helping you identify ROM and RAM consumption hotspots early in development.
Generate memory reports
After building your Zephyr application, you can analyze how memory is allocated and used. Workbench for Zephyr offers built-in memory reporting tools that help you visualize RAM and ROM usage, identify inefficient memory patterns, and guide optimization efforts. These insights are especially useful when working with constrained Arm Cortex-M platforms.
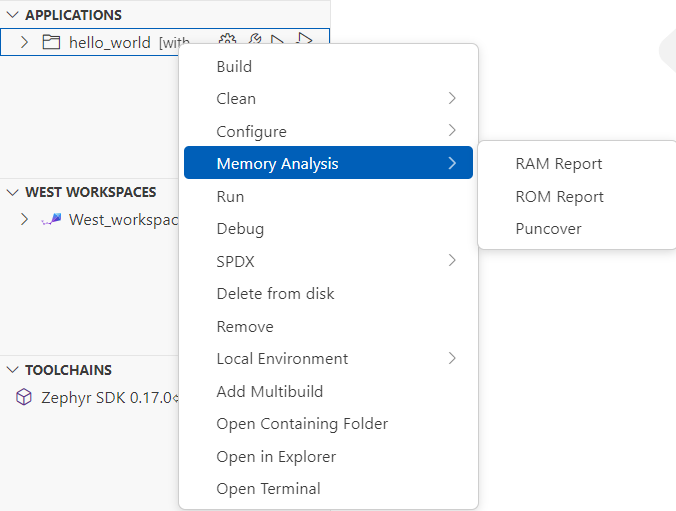
To generate memory reports, open the Workbench for Zephyr panel and select Memory Analysis after building your application. This tool provides detailed insights into RAM usage (including stack, heap, and static variables), ROM usage (such as code size and constants), and integrates Puncover for advanced binary analysis. With Puncover, you can visualize function sizes, call graphs, and timing information specific to Arm Cortex-M processors.
Follow these steps to generate and review memory reports:
- Open the Workbench for Zephyr panel.
- Select Memory Analysis after a successful build.
- Review the generated reports:
- RAM usage: View stack, heap, and static variable allocation.
- ROM usage: Examine code size and constant data.
- Puncover analysis: Explore function sizes, call graphs, and timing metrics for your Arm Cortex-M application.
These insights help you identify memory bottlenecks and optimize your embedded firmware for Arm platforms.
 Workbench for Zephyr Memory Analysis panel
The RAM Report displays detailed memory allocation information and should look like this:
Path Size % Address Section
===================================================================================================================================
Root 4323 100.00% -
├── (hidden) 4 0.09% -
├── (no paths) 3492 80.78% -
│ ├── SystemCoreClock 4 0.09% 0x300000f4 datas
│ ├── _kernel 32 0.74% 0x3000036c bss
│ ├── _thread_dummy 128 2.96% 0x30000240 bss
│ ├── z_idle_threads 128 2.96% 0x30000140 bss
│ ├── z_interrupt_stacks 2048 47.37% 0x300003a0 noinit
│ ├── z_main_stack 1024 23.69% 0x30000ce0 noinit
│ └── z_main_thread 128 2.96% 0x300001c0 bss
├── WORKSPACE 8 0.19% -
│ └── deps 8 0.19% -
│ └── modules 8 0.19% -
│ └── hal 8 0.19% -
│ └── nxp 8 0.19% -
│ └── mcux 8 0.19% -
│ └── mcux-sdk-ng 8 0.19% -
│ └── devices 8 0.19% -
│ └── MCX 8 0.19% -
│ └── MCXN 8 0.19% -
│ └── MCXN947 8 0.19% -
│ └── drivers 8 0.19% -
│ └── fsl_clock.c 8 0.19% -
│ ├── s_Ext_Clk_Freq 4 0.09% 0x300000fc datas
│ └── s_Xtal32_Freq 4 0.09% 0x300000f8 datas
└── ZEPHYR_BASE 819 18.95% -
├── arch 25 0.58% -
│ └── arm 25 0.58% -
│ └── core 25 0.58% -
│ ├── mpu 21 0.49% -
│ │ ├── arm_mpu.c 1 0.02% -
│ │ │ └── static_regions_num 1 0.02% 0x30000398 bss
│ │ └── arm_mpu_v8_internal.h 20 0.46% -
│ │ └── dyn_reg_info 20 0.46% 0x300002e4 bss
│ └── tls.c 4 0.09% -
│ └── z_arm_tls_ptr 4 0.09% 0x300002e0 bss
├── drivers 376 8.70% -
│ ├── clock_control 2 0.05% -
│ │ └── clock_control_mcux_syscon.c 2 0.05% -
│ │ └── __devstate_dts_ord_10 2 0.05% 0x3000010c device_states
│ ├── gpio 70 1.62% -
│ │ └── gpio_mcux.c 70 1.62% -
│ │ ├── __devstate_dts_ord_12 2 0.05% 0x30000116 device_states
│ │ ├── __devstate_dts_ord_14 2 0.05% 0x30000114 device_states
│ │ ├── __devstate_dts_ord_157 2 0.05% 0x3000010e device_states
│ │ ├── __devstate_dts_ord_176 2 0.05% 0x30000112 device_states
│ │ ├── __devstate_dts_ord_19 2 0.05% 0x30000110 device_states
│ │ ├── gpio_mcux_port0_data 12 0.28% 0x30000338 bss
│ │ ├── gpio_mcux_port1_data 12 0.28% 0x3000032c bss
│ │ ├── gpio_mcux_port2_data 12 0.28% 0x30000320 bss
│ │ ├── gpio_mcux_port3_data 12 0.28% 0x30000314 bss
│ │ └── gpio_mcux_port4_data 12 0.28% 0x30000308 bss
│ ├── mfd 232 5.37% -
│ │ └── mfd_nxp_lp_flexcomm.c 232 5.37% -
│ │ ├── __devstate_dts_ord_119 2 0.05% 0x3000011e device_states
│ │ ├── __devstate_dts_ord_123 2 0.05% 0x3000011c device_states
│ │ ├── __devstate_dts_ord_127 2 0.05% 0x3000011a device_states
│ │ ├── __devstate_dts_ord_131 2 0.05% 0x30000118 device_states
│ │ ├── nxp_lp_flexcomm_children_0 48 1.11% 0x300000c4 datas
│ │ ├── nxp_lp_flexcomm_children_1 48 1.11% 0x3000008c datas
│ │ ├── nxp_lp_flexcomm_children_2 48 1.11% 0x30000054 datas
│ │ ├── nxp_lp_flexcomm_children_3 48 1.11% 0x3000001c datas
│ │ ├── nxp_lp_flexcomm_data_0 8 0.19% 0x300000bc datas
│ │ ├── nxp_lp_flexcomm_data_1 8 0.19% 0x30000084 datas
│ │ ├── nxp_lp_flexcomm_data_2 8 0.19% 0x3000004c datas
│ │ └── nxp_lp_flexcomm_data_3 8 0.19% 0x30000014 datas
│ ├── pinctrl 12 0.28% -
│ │ └── pinctrl_nxp_port.c 12 0.28% -
│ │ ├── __devstate_dts_ord_11 2 0.05% 0x3000012a device_states
│ │ ├── __devstate_dts_ord_13 2 0.05% 0x30000128 device_states
│ │ ├── __devstate_dts_ord_156 2 0.05% 0x30000122 device_states
│ │ ├── __devstate_dts_ord_175 2 0.05% 0x30000126 device_states
│ │ ├── __devstate_dts_ord_18 2 0.05% 0x30000124 device_states
│ │ └── __devstate_dts_ord_83 2 0.05% 0x30000120 device_states
│ ├── serial 36 0.83% -
│ │ └── uart_mcux_lpuart.c 36 0.83% -
│ │ ├── __devstate_dts_ord_125 2 0.05% 0x3000012e device_states
│ │ ├── __devstate_dts_ord_133 2 0.05% 0x3000012c device_states
│ │ ├── mcux_lpuart_0_data 16 0.37% 0x30000354 bss
│ │ └── mcux_lpuart_1_data 16 0.37% 0x30000344 bss
│ └── timer 24 0.56% -
│ └── cortex_m_systick.c 24 0.56% -
│ ├── announced_cycles 8 0.19% 0x30000130 bss
│ ├── cycle_count 8 0.19% 0x30000138 bss
│ ├── last_load 4 0.09% 0x30000368 bss
│ └── overflow_cyc 4 0.09% 0x30000364 bss
├── kernel 378 8.74% -
│ ├── init.c 321 7.43% -
│ │ ├── z_idle_stacks 320 7.40% 0x30000ba0 noinit
│ │ └── z_sys_post_kernel 1 0.02% 0x30000399 bss
│ ├── timeout.c 20 0.46% -
│ │ ├── announce_remaining 4 0.09% 0x30000394 bss
│ │ ├── curr_tick 8 0.19% 0x300002d8 bss
│ │ └── timeout_list 8 0.19% 0x30000104 datas
│ └── timeslicing.c 37 0.86% -
│ ├── pending_current 4 0.09% 0x3000038c bss
│ ├── slice_expired 1 0.02% 0x3000039a bss
│ ├── slice_max_prio 4 0.09% 0x30000390 bss
│ ├── slice_ticks 4 0.09% 0x30000100 datas
│ └── slice_timeouts 24 0.56% 0x300002c0 bss
└── lib 40 0.93% -
├── libc 32 0.74% -
│ ├── common 12 0.28% -
│ │ └── source 12 0.28% -
│ │ └── stdlib 12 0.28% -
│ │ └── malloc.c 12 0.28% -
│ │ └── z_malloc_heap 12 0.28% 0x300002fc bss
│ └── picolibc 20 0.46% -
│ └── stdio.c 20 0.46% -
│ ├── __stdout 16 0.37% 0x30000004 datas
│ └── _stdout_hook 4 0.09% 0x300002f8 bss
├── os 4 0.09% -
│ └── printk.c 4 0.09% -
│ └── _char_out 4 0.09% 0x30000000 datas
└── utils 4 0.09% -
└── last_section_id.c 4 0.09% -
└── last_id 4 0.09% 0x10005f00 .last_section
==========================================================================================================================================
4323
Install and configure debug runners
Depending on your board, different debug utilities may be required. Workbench for Zephyr integrates and discovers several common runners:
- OpenOCD: Generic open-source debugger
- LinkServer: For NXP targets
- STM32CubeProgrammer: For STM32 boards
- J-Link: For SEGGER debug probes
Workbench for Zephyr will automatically detect these tools when they are installed in their default locations and available on your system PATH. If a tool is installed in a custom location, you can either update your PATH or configure your environment so that Workbench for Zephyr can find it.
Install runners utilities
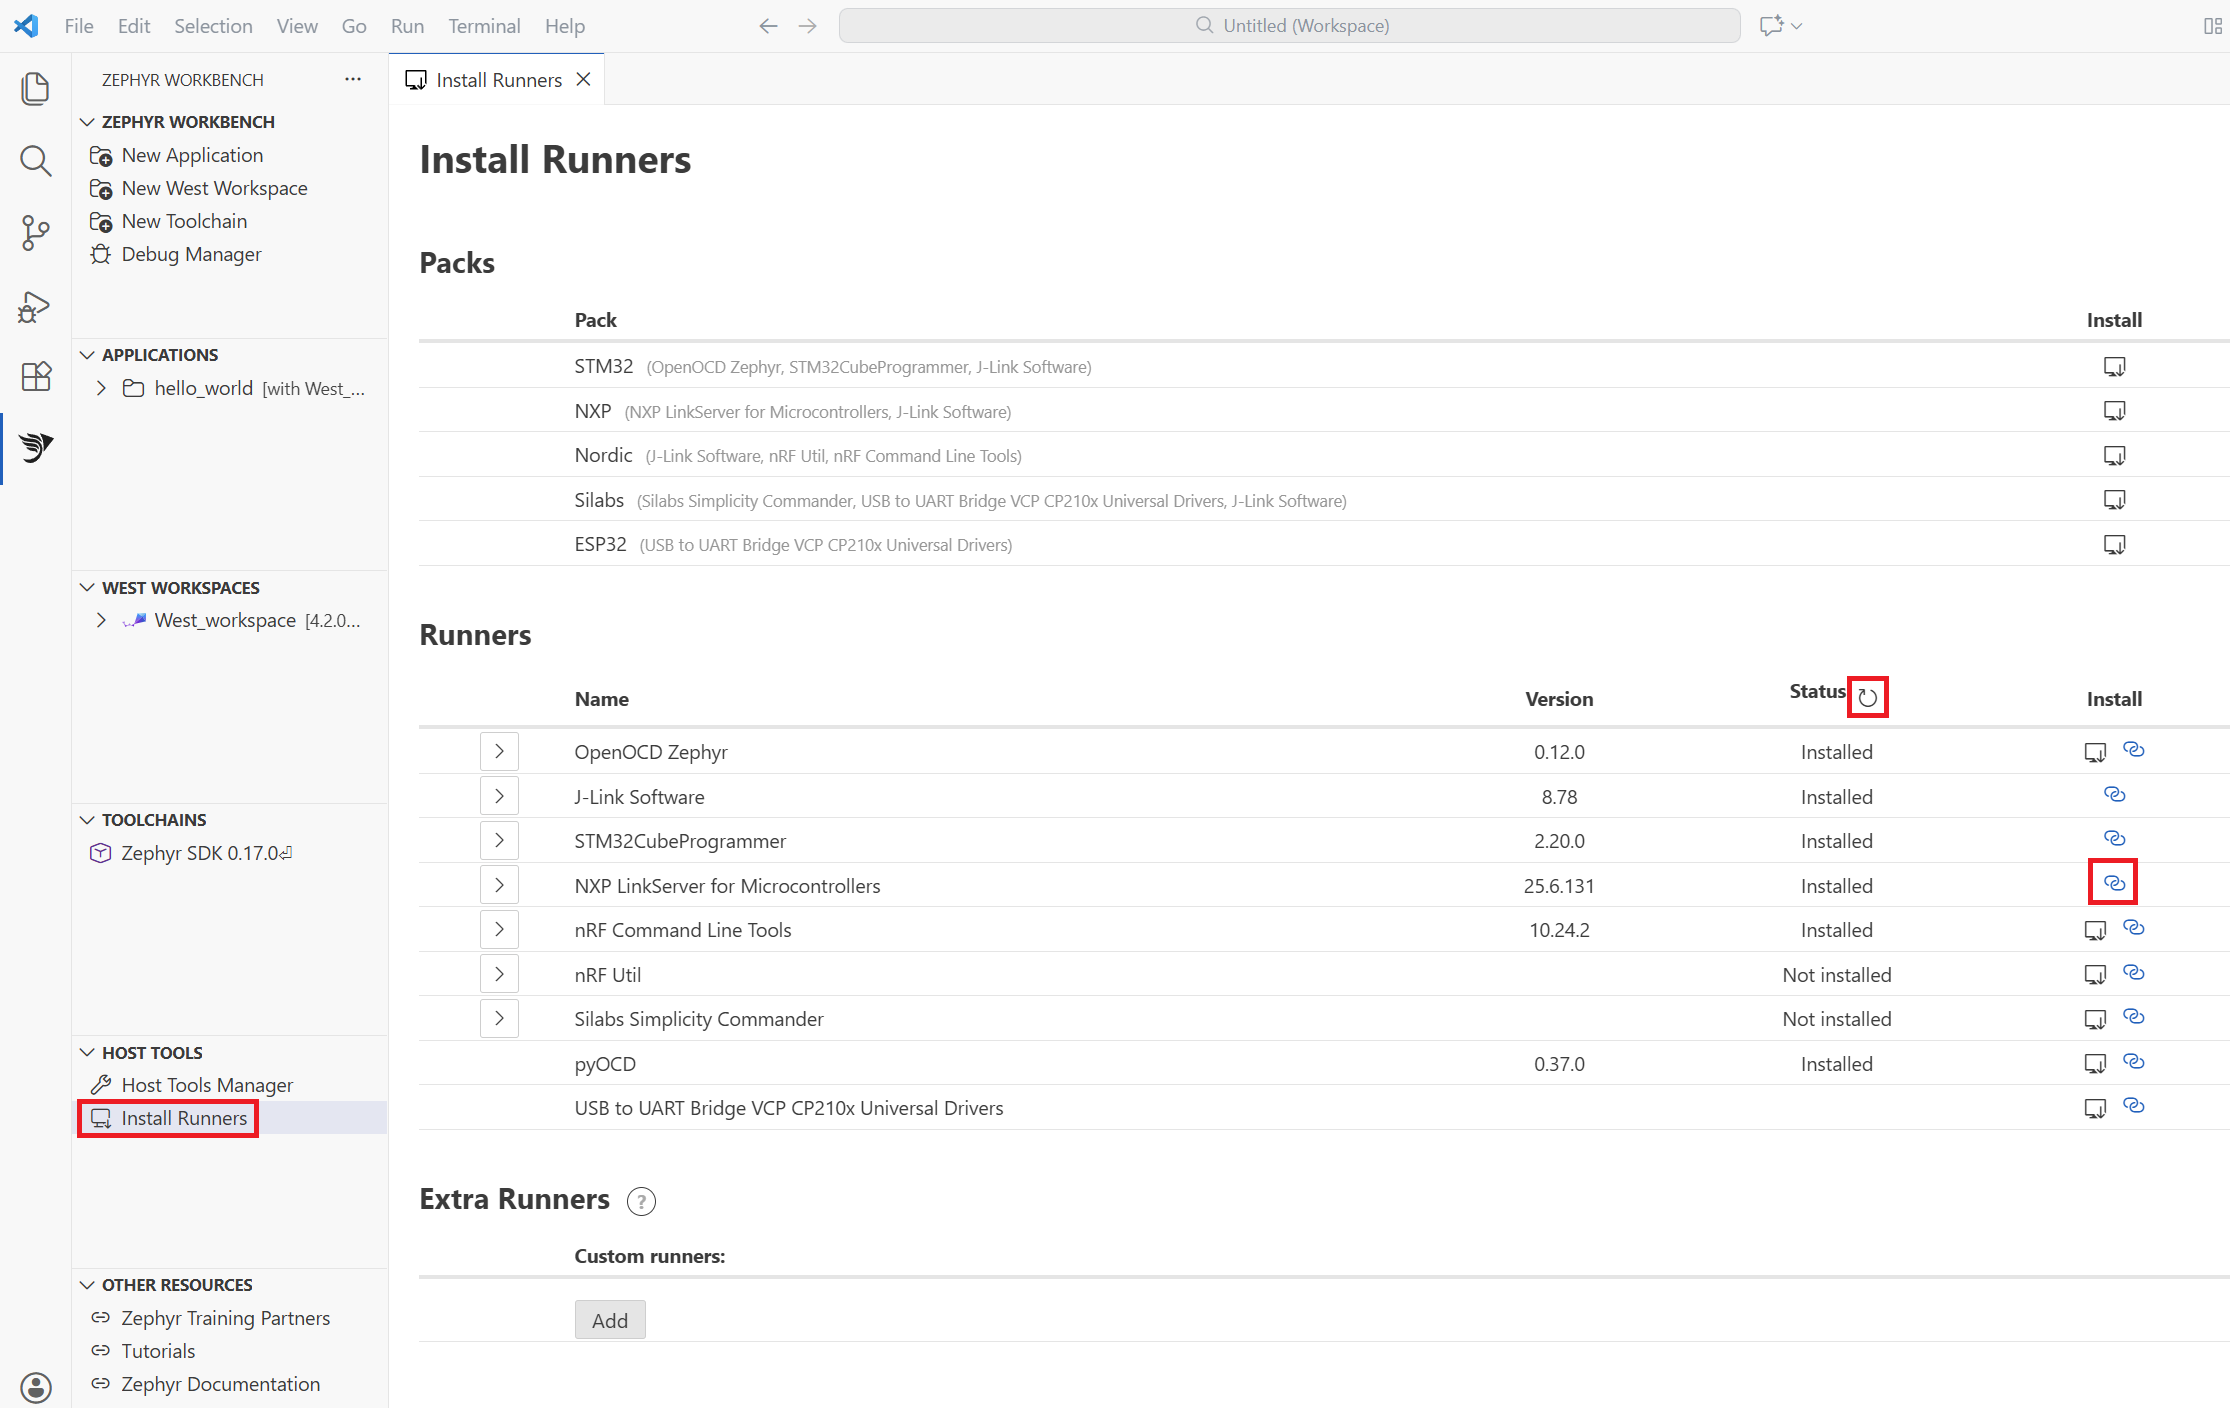
To install debug tools for your specific board, go to Host Tools > Install Debug Tools in the Zephyr Workbench panel and select the tools applicable to your board. You may need to press the refresh symbol to get the latest installation state for the selected/installed runners:
 Install Debug Runners panel in Workbench for Zephyr showing a list of available debug runner tools with checkboxes for selection
Configure debug settings
Before starting a debug session, make sure your settings match your application and board configuration.
Application configuration
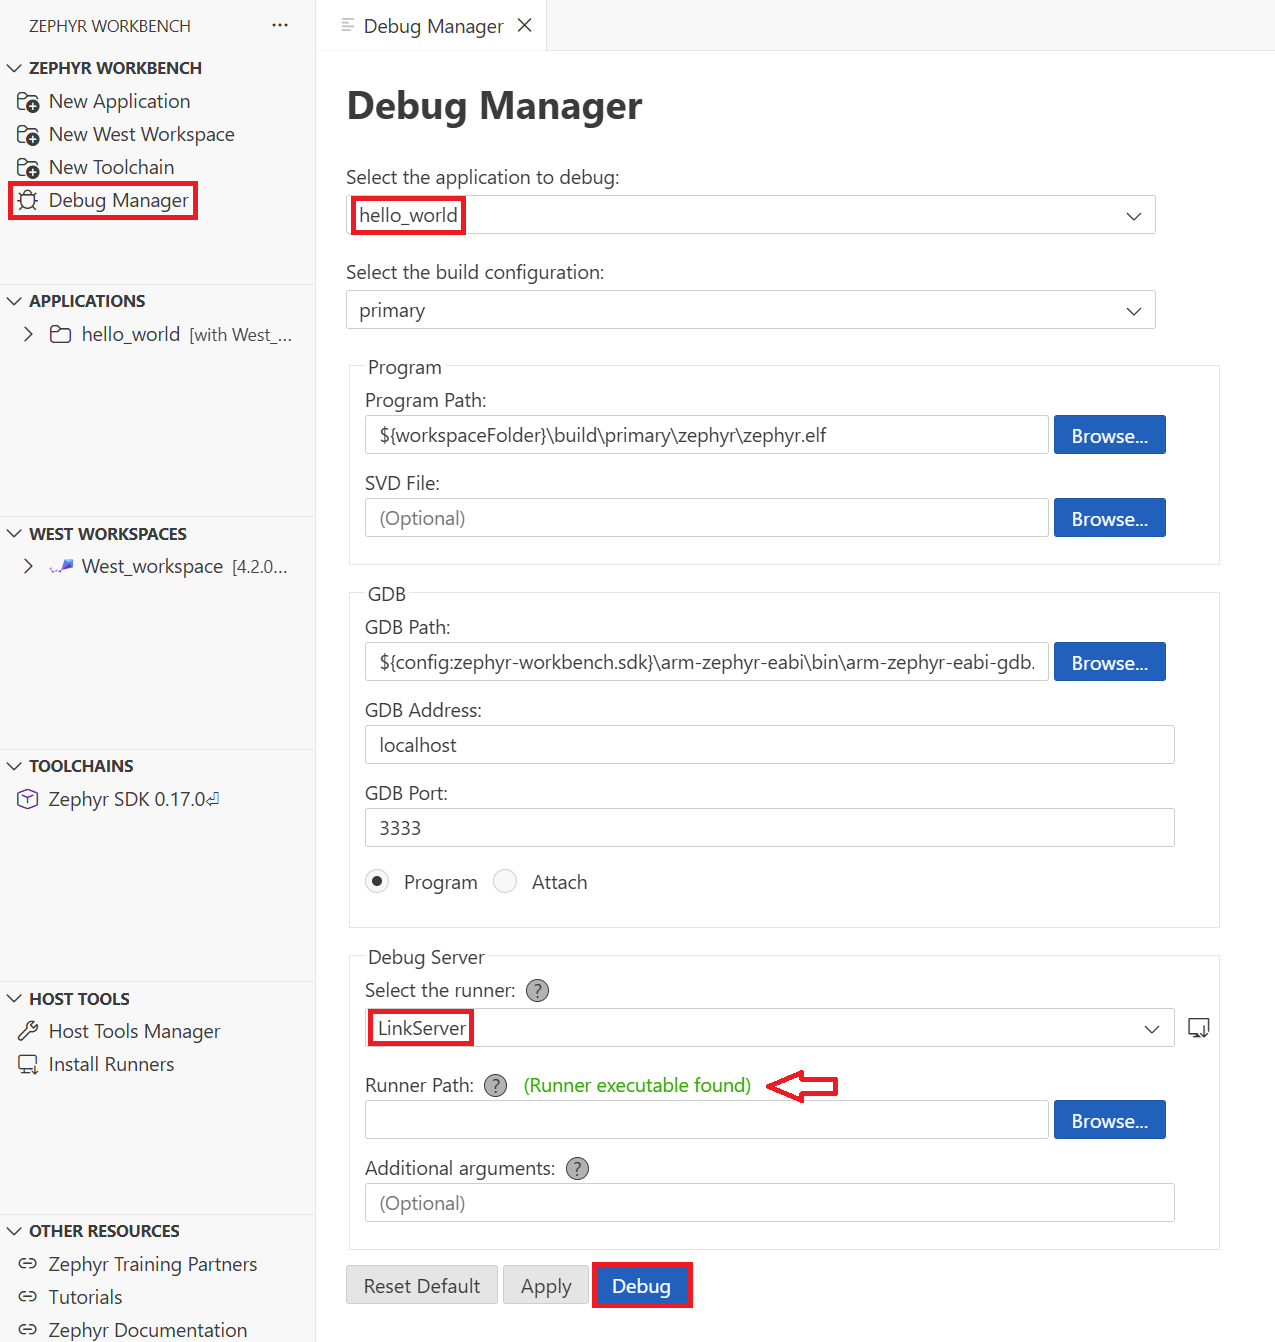
Select your application and build config (for example, “primary”), then wait for values to load or build the project if needed.
Program settings
The ELF executable path is auto-filled after build. You can optionally add a CMSIS-SVD file to enable register-level view.
Debug server
Choose the runner from OpenOCD, J-Link, LinkServer, or PyOCD. If the system doesn’t detect your runner automatically, enter the runner path manually. Select Apply to save your settings or launch debug directly.
 Debug Manager panel in Workbench for Zephyr
Configure manual debug runner
If Workbench for Zephyr doesn’t automatically detect the installed debug runner, open the Debug Manager from the sidebar and locate your board profile to enter the path to the runner executable manually.
Launch and use the debugger
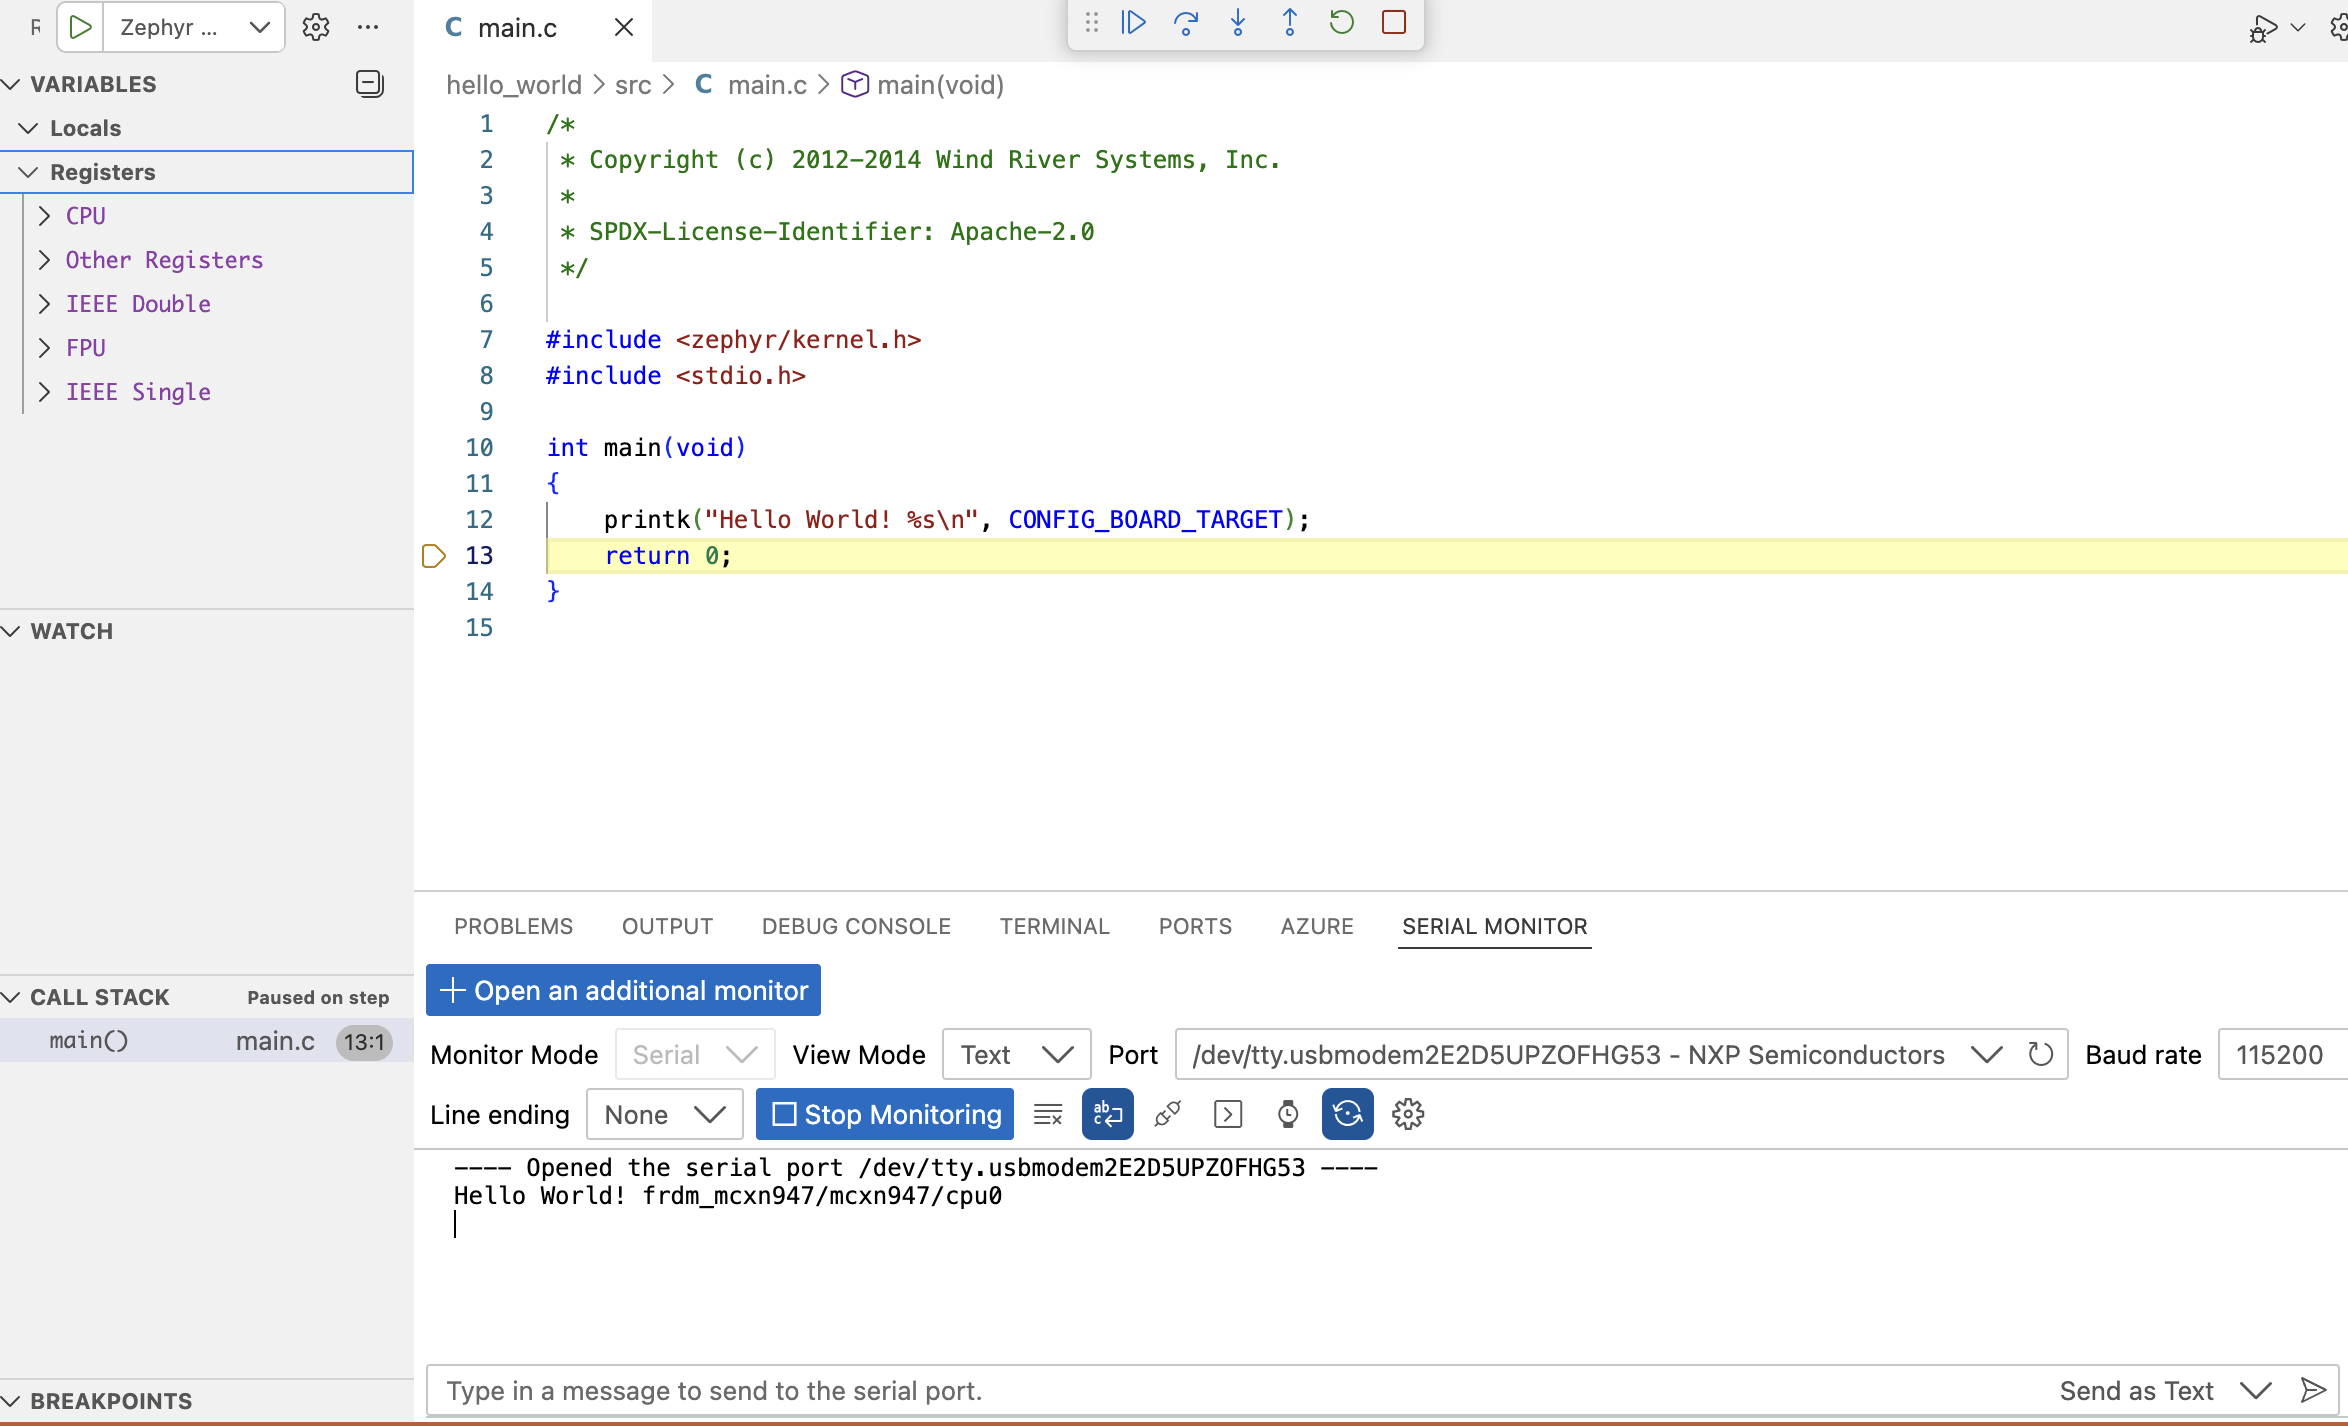
You can start debugging from Workbench for Zephyr by selecting Debug, or from VS Code by going to Run and Debug (Ctrl+Shift+D), selecting the debug config, and selecting Run.
 VS Code window displaying the Zephyr Workbench Debug Application panel.
Debug toolbar controls
The debug toolbar provides the following controls for stepping through your code:
- Continue/Pause (F5)
- Step Over (F10)
- Step Into (F11)
- Step Out (Shift+F11)
- Restart (Ctrl+Shift+F5)
- Stop (Shift+F5)
Debug features
The debugger provides comprehensive inspection capabilities including breakpoints and variable watches, Register view for Arm CPU states, Call stack navigation, and Memory view of address space.
If using pyocd, target support might take a few seconds to initialize.
What you accomplished
In this Learning Path, you explored how to analyze memory usage and debug Zephyr applications using Workbench for Zephyr. You learned to generate memory reports, install and configure debug tools, and launch interactive debug sessions. These steps help you troubleshoot and optimize embedded applications for Arm Cortex-M boards.