Build Zephyr projects with Workbench for Zephyr in VS Code
Introduction
Set up your environment
Build a Zephyr application with Zephyr workbench
Analyze and debug a Zephyr application
Next Steps
Build Zephyr projects with Workbench for Zephyr in VS Code
Set up your Zephyr development board and environment
In this section, you’ll learn how to create and build your first Zephyr application using Workbench for Zephyr. This step prepares you to customize, test, and expand real firmware projects on Arm Cortex-M boards. For this demonstration, you’ll use an NXP FRDM-MCXN947 development board as your target device. The same process works for any Zephyr-supported Arm Cortex-M board.
To see all compatible boards, visit the Zephyr Supported Boards list .
Depending on your board, you might need to install a different debug tool aka runner. The next section covers this setup.
Create the application
In the Zephyr Workbench panel:
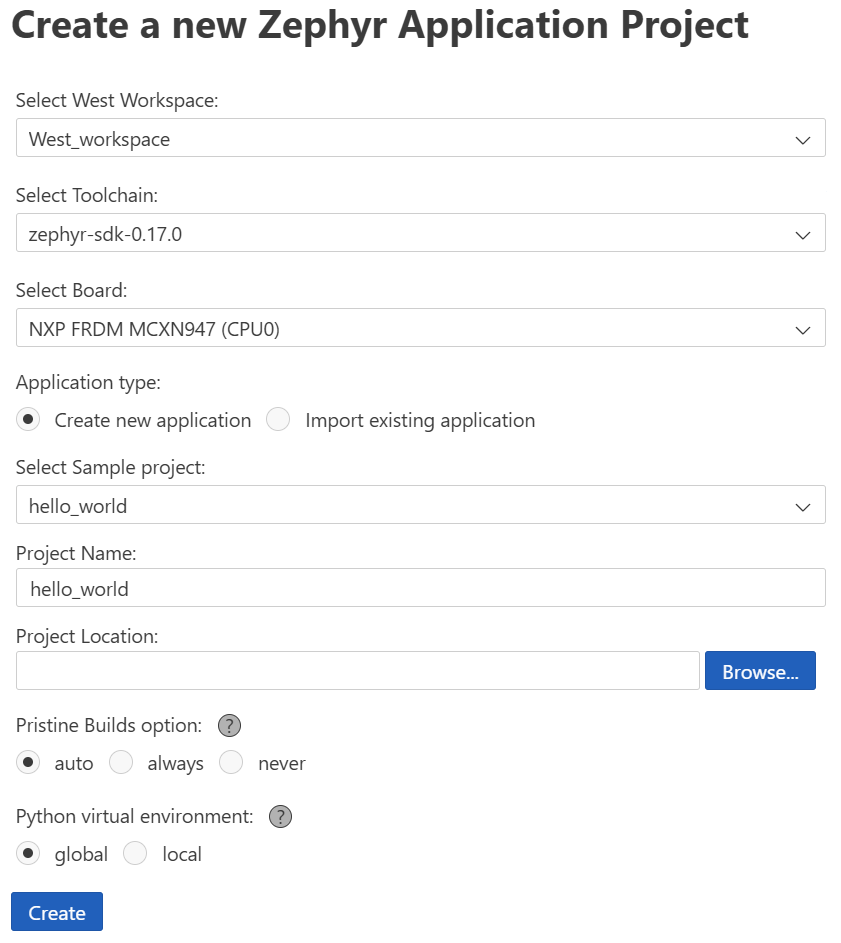
Select Create New Application in the Zephyr Workbench panel.
Configure your project:
- Select the workspace and SDK version.
- Choose your target board (for example, NXP FRDM-MCXN947).
- Select a sample application (for example, hello_world).
- Enter a project name.
After you complete these steps, Workbench for Zephyr creates the project and prepares it for building.
 Zephyr Workbench Create New Application panel
Build the application
Select the Build button in Workbench for Zephyr or press Ctrl+Shift+B.
The build system compiles your application and links it against the Zephyr kernel and board-specific drivers.
![VS Code Zephyr Workbench build application panel showing workspace selection, SDK version, target board dropdown, sample application selection, and project name fields. The primary subject is the Zephyr Workbench interface guiding users through building a Zephyr application. Visible text includes labels such as Workspace, SDK, Target Board, Sample Application, and Project Name, with buttons for Create New Application and Build. The wider VS Code environment is visible in the background, presenting a clean and organized workspace with a neutral, professional tone. alt-text#center]
Install board-specific debug utilities
To enable debugging on your target hardware, you might need to install additional tools based on the board vendor.
For the NXP FRDM-MCXN947, download and install the LinkServer debug utility:
- LinkServer for Microcontrollers: NXP LinkServer Download Page
Once installed, Workbench for Zephyr attempts to detect it automatically during a debug session. If you’re using a different board, see your vendor’s documentation to install the appropriate debug utility.
If Workbench for Zephyr doesn’t automatically detect the installed debug runner, you can manually configure it. Open the Debug Manager from the Zephyr sidebar, and enter the full path to the runner executable.
Review the output
Check the build output at the bottom panel of VS Code. Make sure there are no errors or warnings. A successful build displays:
        Building ‘hello_world’ for frdm_mcxn947
Memory region         Used Size  Region Size  % Used
           FLASH:      19844 B         1 MB      1.9%
            SRAM:       4048 B       256 KB      1.5%
Code walkthrough: hello_world
The following code shows a basic Zephyr application that prints a message to the console:
#include <zephyr/kernel.h>
#include <zephyr/stdio.h>

int main(void)
{
    printk("Hello World! %s\n", CONFIG_BOARD_TARGET); // Prints board name to serial console
    return 0;
}
CONFIG_BOARD expands to your target board name. You’ll modify this app in the next module!
Try this: modify and rebuild
Now that the app works, try editing the message in printk() or changing the board target in the application settings. Then rebuild and observe the output. This helps verify that your toolchain and workspace respond correctly to code and config changes.
With your first Zephyr application successfully built, you’re ready to take the next step, which is debugging. In the next module, you’ll launch a debug session, set breakpoints, and perform memory analysis using Workbench for Zephyr. These skills help you validate and optimize applications running on real Arm Cortex-M hardware.