Profile the Linux kernel with Arm Streamline
Introduction
Profile Linux kernel modules with Arm Streamline
Set up your environment
Build the out-of-tree kernel module
Profile the out-of-tree kernel module
Integrate a custom character device driver into the Linux kernel
Profile the in-tree kernel driver
Use Streamline with the Statistical Profiling Extension
Summary
Next Steps
Using the Statistical Profiling Extension (SPE) for better analysis
With periodic sampling, Streamline uses hardware counters and software interrupts to collect CPU performance data. Hardware counters only show total event counts, so you can’t tell which instructions triggered them. At most, you can connect these counts to a general area of code, not specific lines. This makes it harder to find the root cause of performance issues. Sampling the Program Counter (PC) or call stack is also limited, because software timers control both sampling and unwinding.
The Statistical Profiling Extension (SPE) solves these problems by sampling the Program Counter (PC) directly in hardware, right inside the CPU pipeline. This approach adds almost no overhead, so you can use a much higher sampling rate than with software-based methods. SPE also collects extra details about each sampled instruction, giving you a much clearer picture of how your code runs and where performance issues might be hiding.
To learn more about how SPE works with Streamline, see Introduction to statistical profiling support in Streamline .
To find out if your target supports SPE, see the Streamline user guide .
Profile the kernel module using SPE
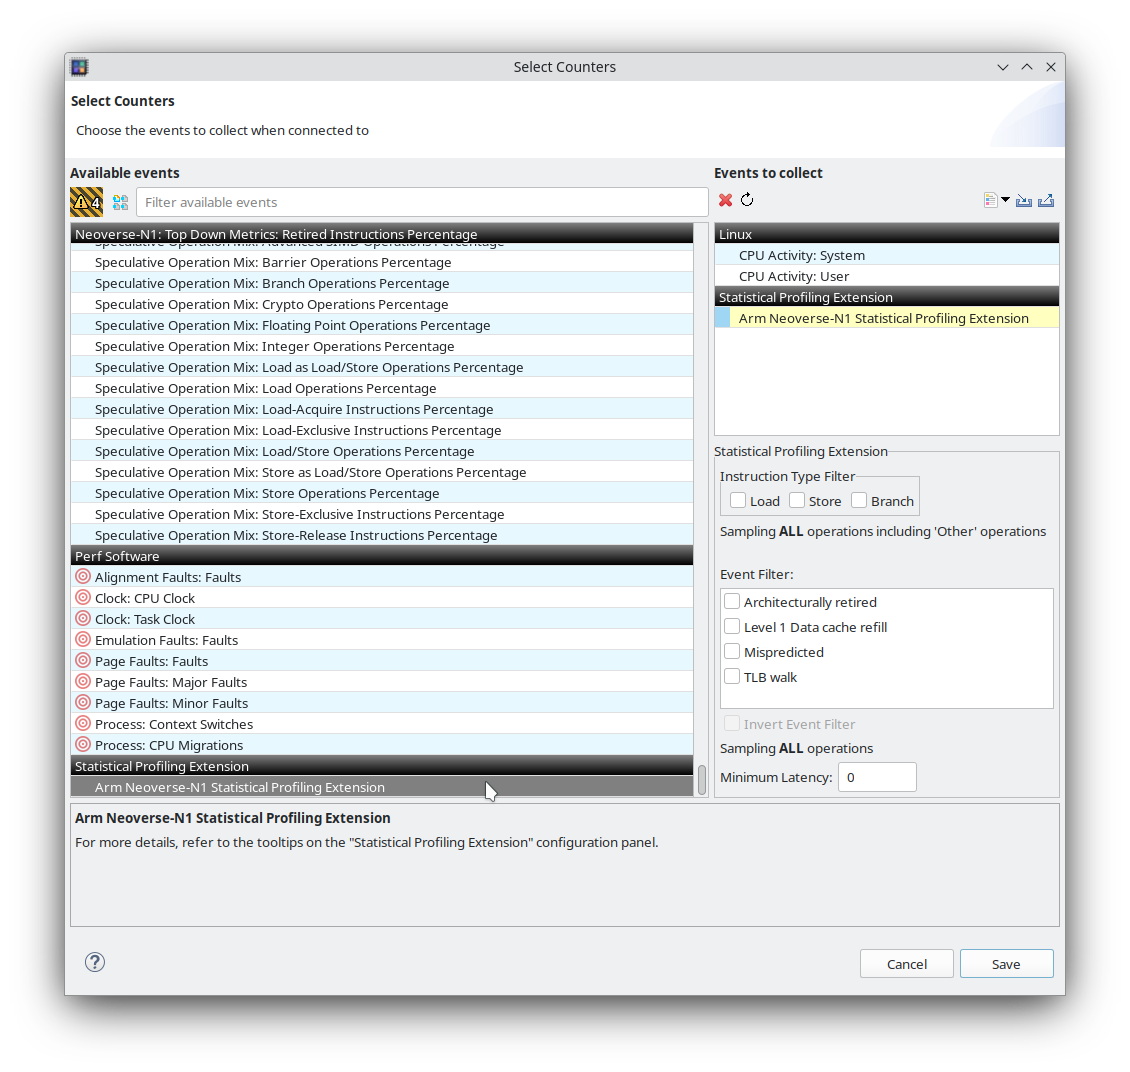
To profile both in-tree and out-of-tree kernel modules, you can use the same setup steps as before. The only change is to add “Arm Statistical Profiling Extension” to the Events to Collect list in the Counter Configuration dialog.
 Streamline Counter Configuration dialog with Arm Statistical Profiling Extension selected
After saving the counter configurations, Click Start capture to begin data collection, then wait for Streamline to analyze results.
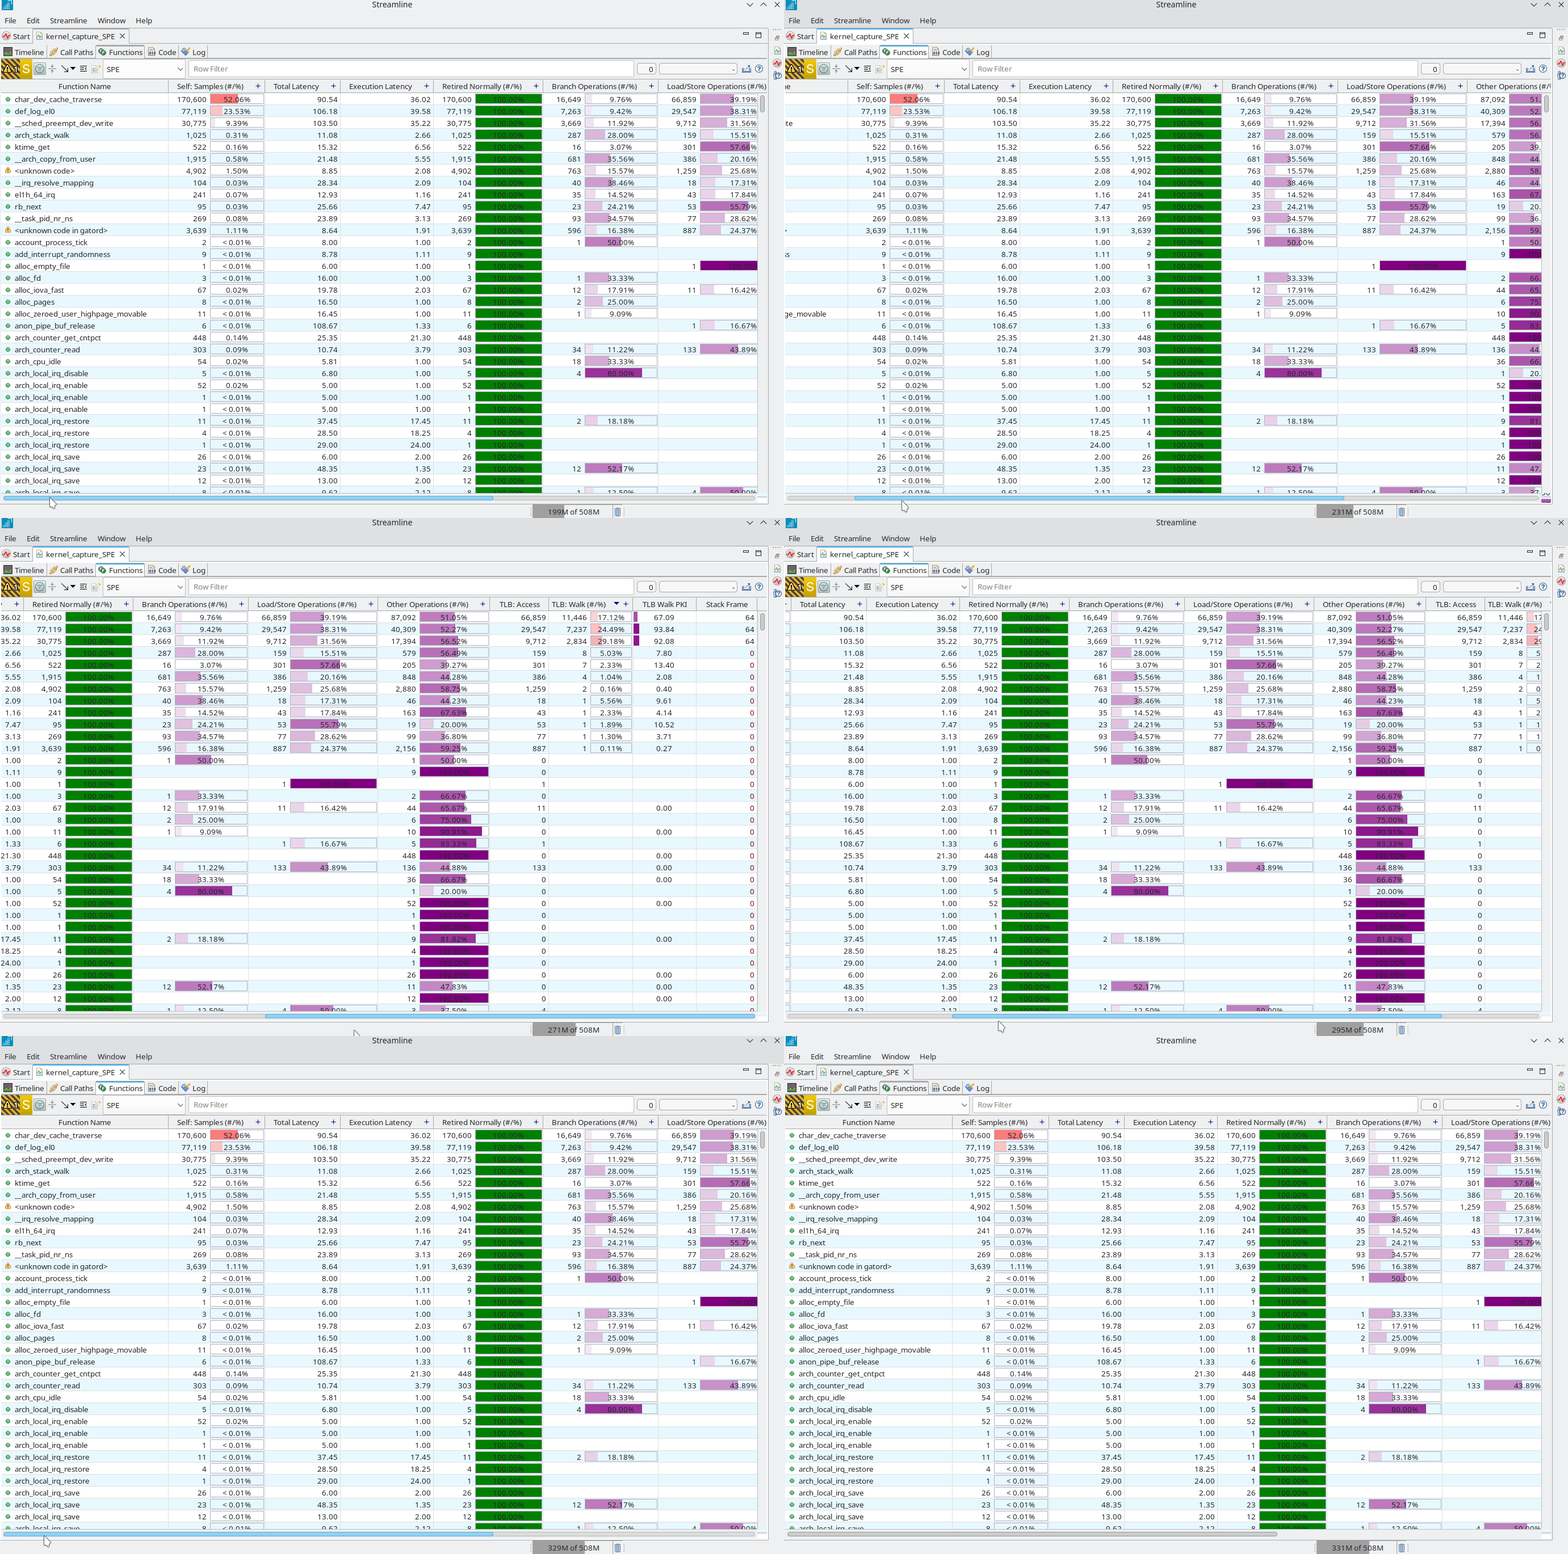
To view SPE counter values, Select SPE in the data source drop-down in the Call paths, Functions, or Code view.
As shown in the image, SPE provides much more data about the profiled code than Event-Based Sampling (EBS), which provides us with deep insights into the CPU performance bottlenecks with very low overhead. It’s also possible to view or hide columns from the table in Call paths or Functions views by menu-clicking on the table header and choosing from the list of columns.
Analyze profiling results with the SPE function tab
The following image shows the Streamline application window with the Statistical Profiling Extension (SPE) function tab selected. The main area lists functions with columns for metrics such as sample count, percentage, and address. The SPE data source is highlighted in the drop-down menu, making it easy to focus on profiling results collected with SPE.
 Streamline application window displaying the Statistical Profiling Extension (SPE) function tab