Profile the Linux kernel with Arm Streamline
Introduction
Profile Linux kernel modules with Arm Streamline
Set up your environment
Build the out-of-tree kernel module
Profile the out-of-tree kernel module
Integrate a custom character device driver into the Linux kernel
Profile the in-tree kernel driver
Use Streamline with the Statistical Profiling Extension
Summary
Next Steps
Use Streamline to profile an in-tree kernel driver
Profiling in-tree drivers follows almost the same process as profiling an out-of-tree kernel module. The steps include:
Transferring
gatorto the target device usingscpLaunching Streamline, selecting TCP view, and entering the target’s IP or hostname
Setting up counters and enabling Event-Based Sampling (EBS)
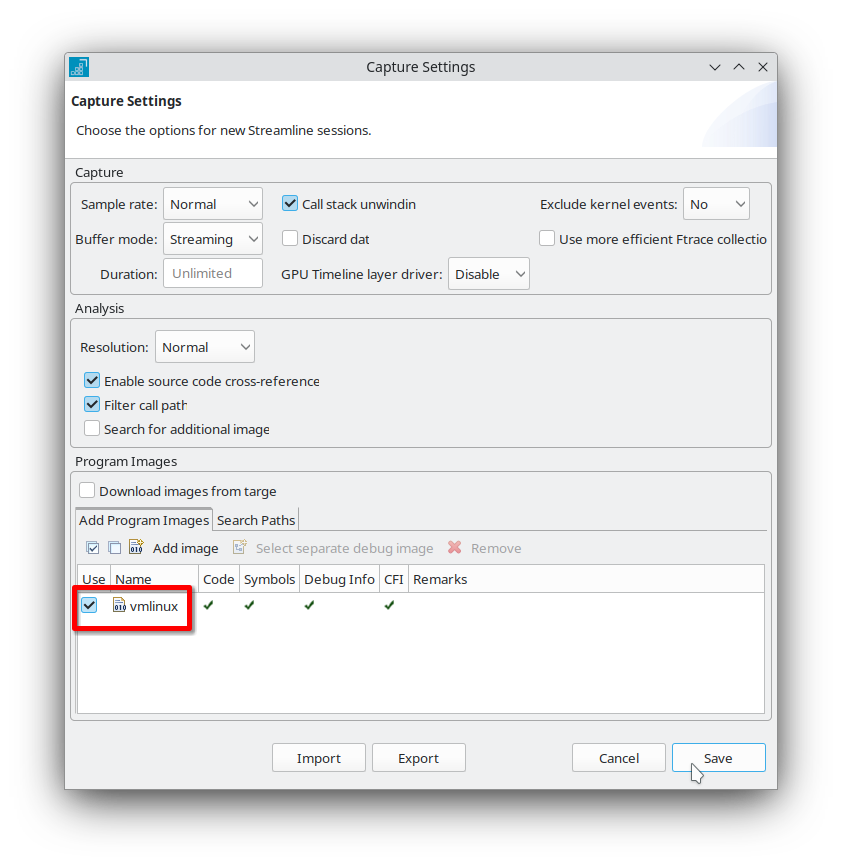
The main difference is that, instead of adding the kernel module’s object file as the capture image in Capture settings, you use the Linux ELF file (vmlinux) generated by Buildroot.
 Streamline Capture settings dialog showing vmlinux selected as the capture image
After you select vmlinux as the capture image in the Capture settings dialog, select Save to apply your changes.
Now, start the capture session. Streamline collects profiling data from the in-tree kernel driver and the rest of the kernel. When the capture completes, analyze the results using the same workflow as before.
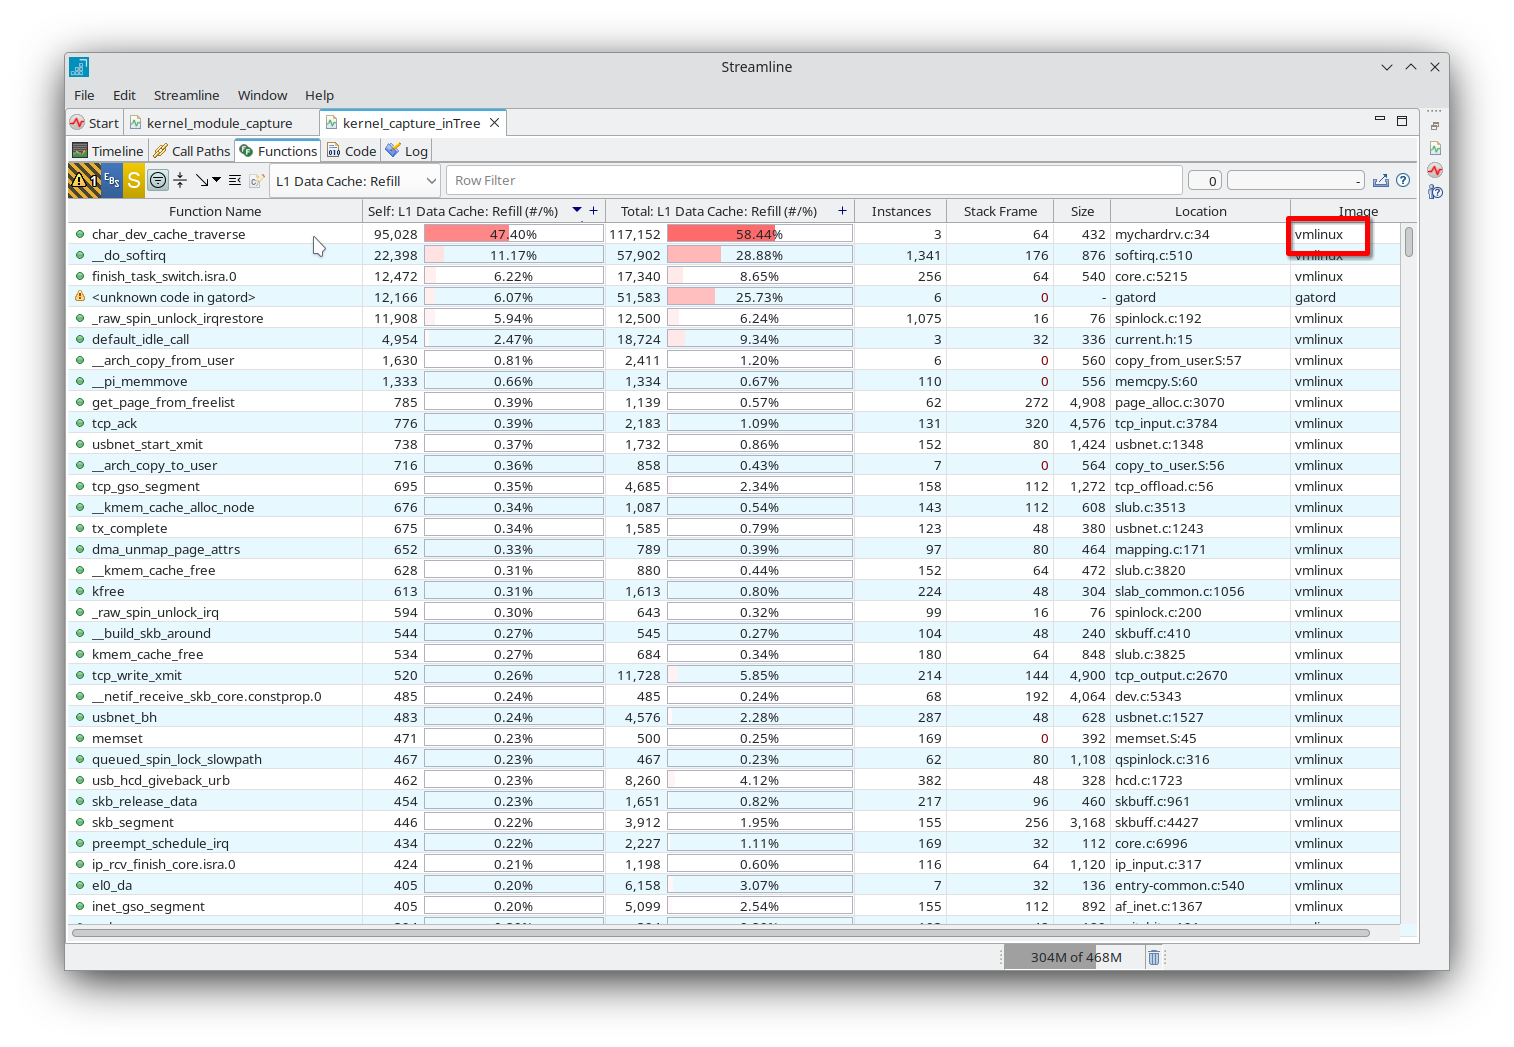
You can review function-level metrics, explore call paths, and identify performance hotspots within both your driver and the kernel.
 Streamline function tab displaying profiling data for vmlinux
Because you selected the vmlinux image, Streamline displays both your driver functions and all other kernel functions sampled during profiling. This lets you see how your driver interacts with the rest of the kernel.
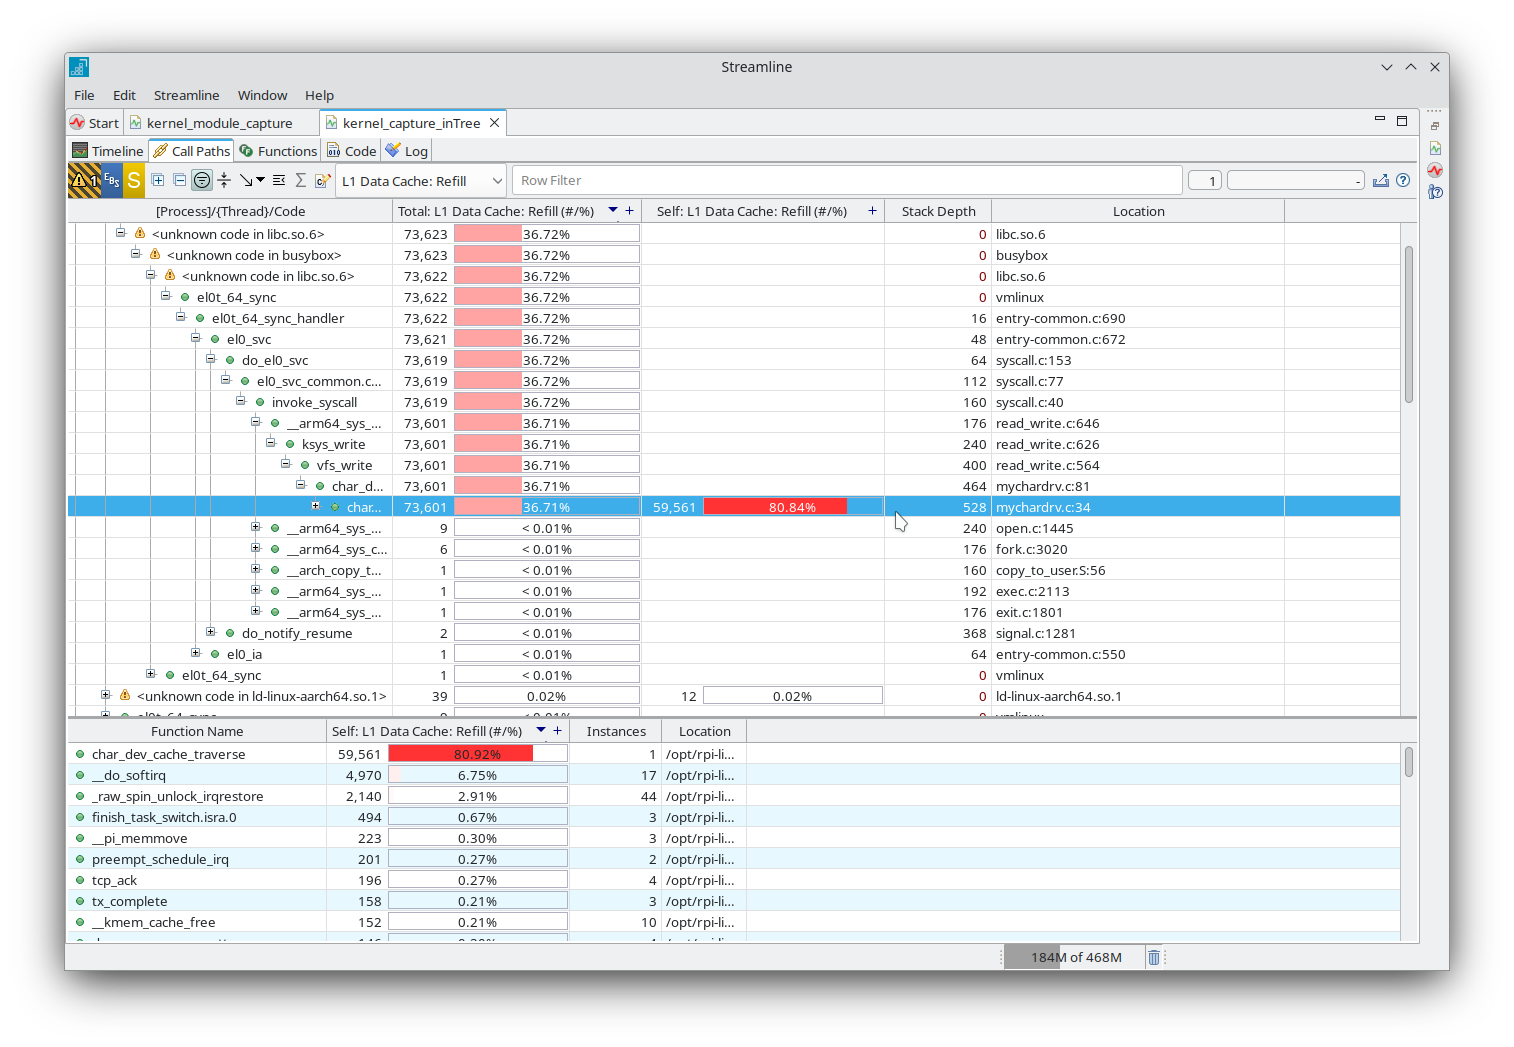
You can also explore the complete call path for any sampled function. This helps you understand how execution flows through your driver and the kernel, making it easier to identify performance bottlenecks or unexpected behavior.
 Streamline call paths tab displaying hierarchical call stack data for vmlinux