Profile the Linux kernel with Arm Streamline
Introduction
Profile Linux kernel modules with Arm Streamline
Set up your environment
Build the out-of-tree kernel module
Profile the out-of-tree kernel module
Integrate a custom character device driver into the Linux kernel
Profile the in-tree kernel driver
Use Streamline with the Statistical Profiling Extension
Summary
Next Steps
Use Streamline to profile an out-of-tree kernel module
Arm Streamline is a tool that uses sampling to measure system performance. Instead of recording every single event (like instrumentation does, which can slow things down), it takes snapshots of hardware counters and system registers at regular intervals. This gives a statistical view of how the system runs, while keeping the overhead small.
Streamline tracks performance metrics such as CPU usage, execution cycles, memory access, cache hits and misses, and GPU activity. By putting this information together, it helps developers see how their code is using the hardware. Captured data is presented on a timeline, so you can see how performance changes as your program runs. This makes it easier to notice patterns, find bottlenecks, and link performance issues to specific parts of your application.
For more information about Streamline and its features, see the Streamline user guide .
Download Streamline
Streamline is included with Arm Performance Studio, which you can download and use for free. Download it by following the link below:
Arm Performance Studio downloads .
For step-by-step guidance on setting up Streamline on your host machine, follow the installation instructions provided in the Streamline installation guide .
Push Gator to the target and make a capture
Once Streamline is installed on the host machine, you can capture trace data of our Linux kernel module. On Linux, the binaries will be installed where you extracted the package.
To communicate with the target device, Streamline uses a background service called gatord. This daemon must be running on the target before you can capture trace data. Streamline provides two pre-built gatord binaries in the installation directory: one for Armv7 (AArch32) and one for Armv8 or later (AArch64) systems.
Use scp to transfer the appropriate gatord binary to your target device:
scp `<install_directory>`/streamline/bin/linux/arm64/gatord root@<target-ip>:/root/gatord
If you are using an AArch32 target, use arm instead of arm64.
Run gator on the target to start system-wide capture mode:
/root/gatord -S yes -a
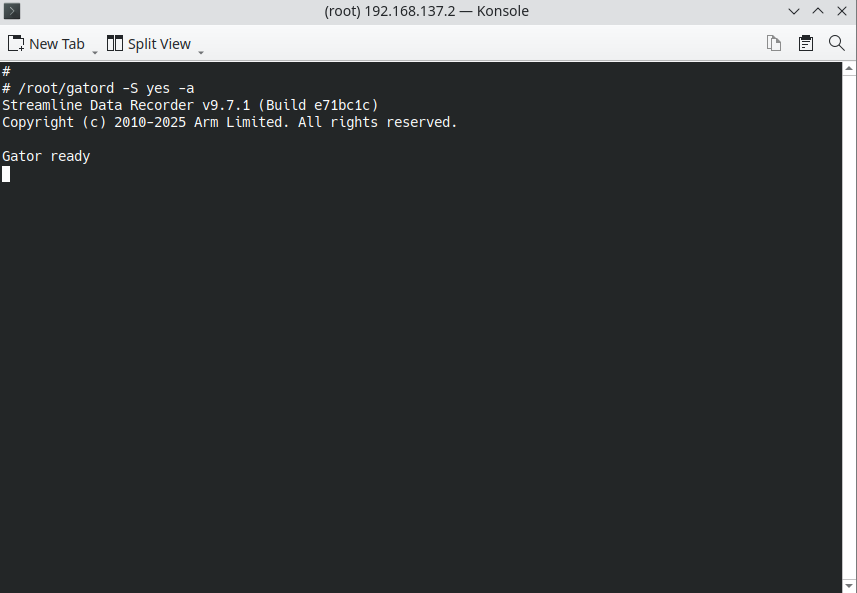 Start gatord on the target device
Open Streamline and choose TCP mode. Enter your target hostname or IP address.
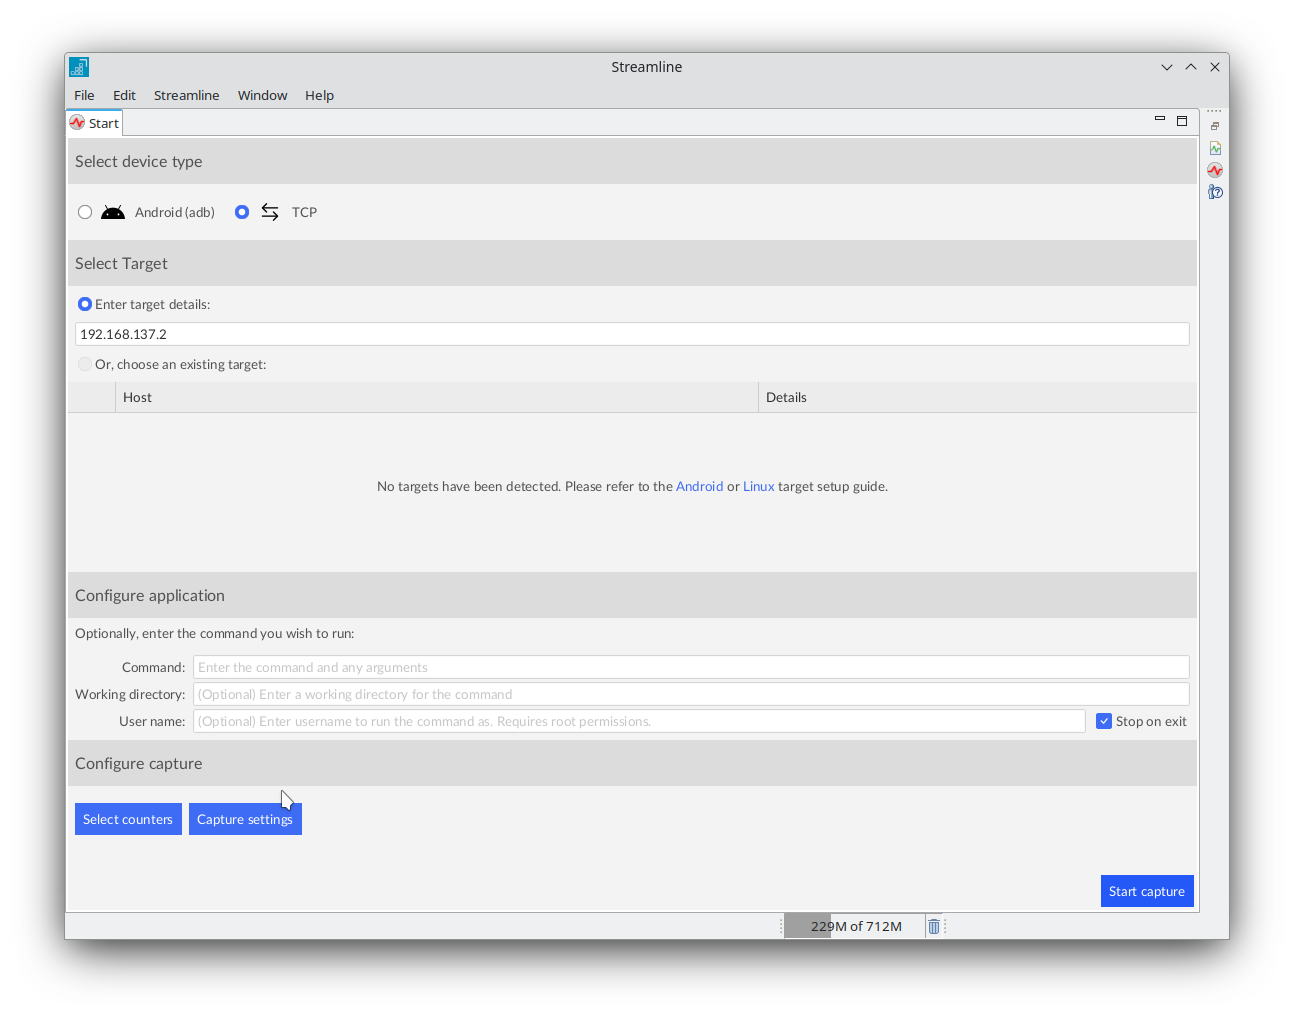 Configure TCP connection to target device
Select Select counters to open the counter configuration dialogue.
Add L1 data Cache: Refill and L1 Data Cache: Access and enable Event-Based Sampling (EBS) for both of them as shown in the screenshot and select Save.
To learn more about counters, see the Arm Developer Counter Configuration Guide .
To learn more about EBS, see the Streamline User Guide .
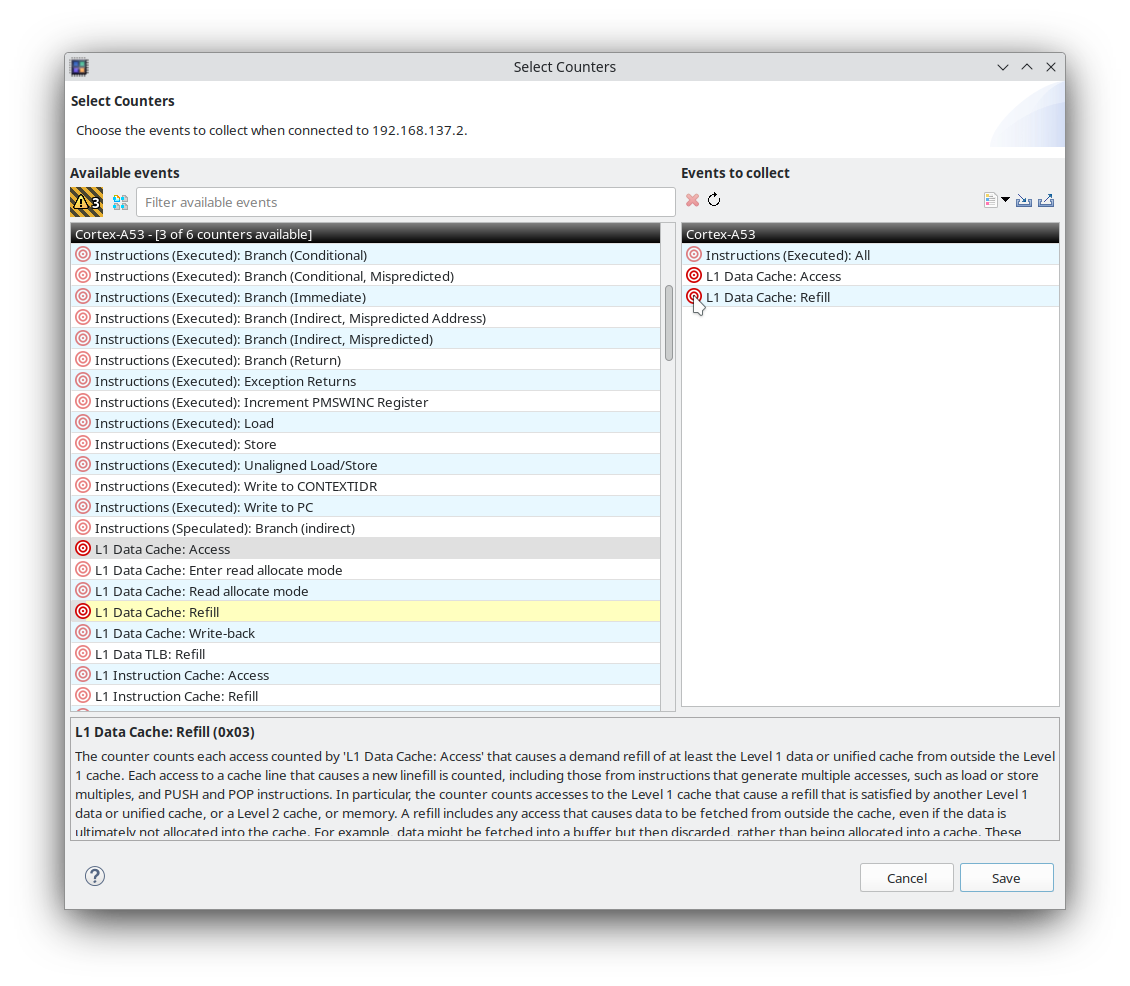 Configure counters and enable event-based sampling
In the Command section, add the same shell command you used earlier to test the Linux module:
sh -c "echo 10000 > /dev/mychardrv"
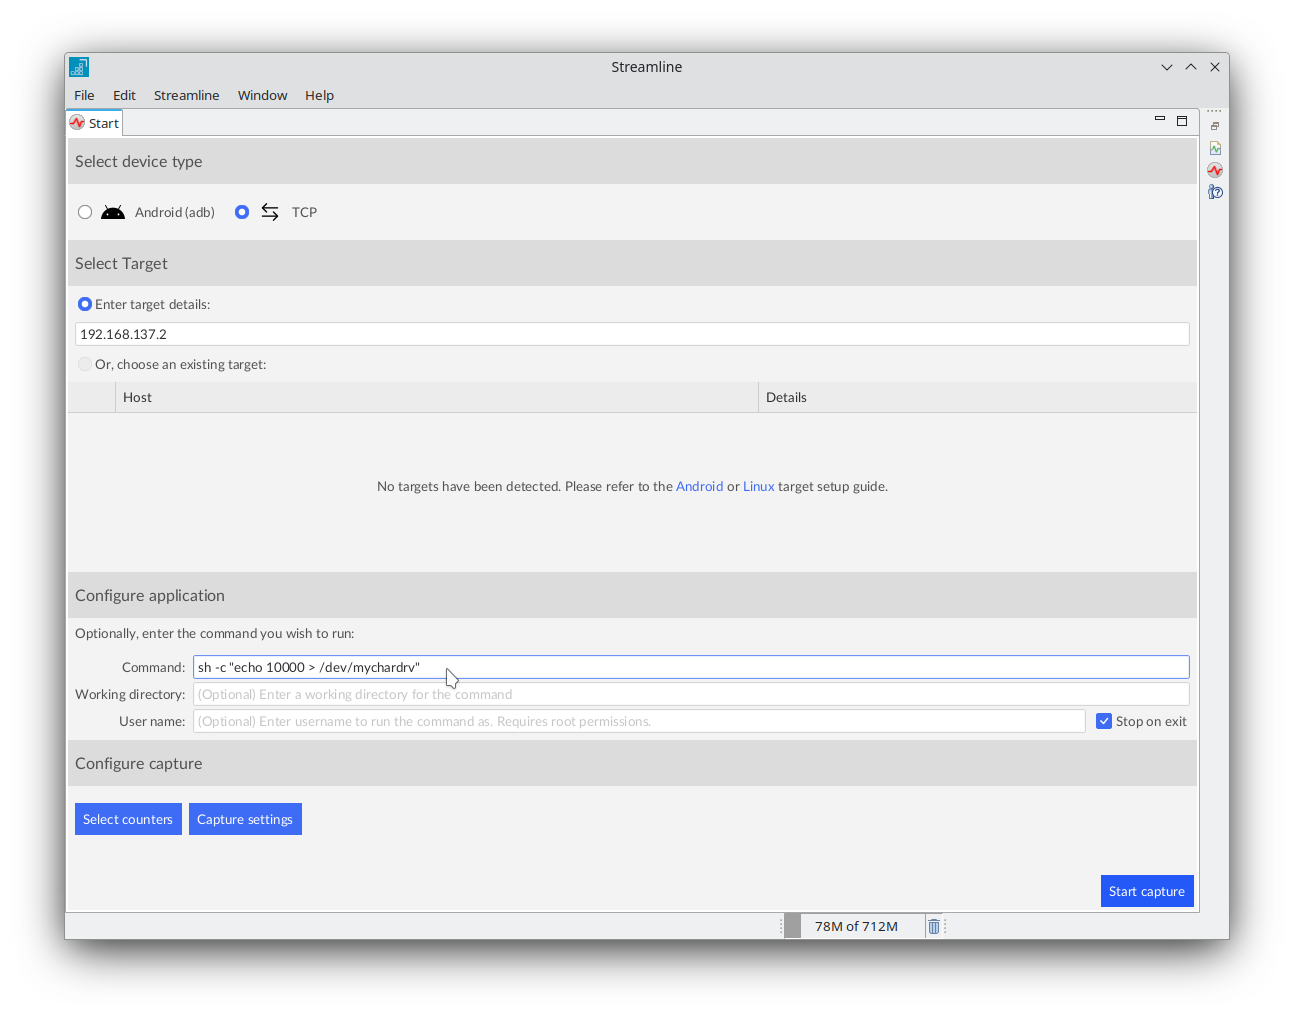 Enter shell command for profiling in Streamline
In the Capture settings dialog, select Add image, add the absolute path of your kernel module file mychardrv.ko, and click Save.
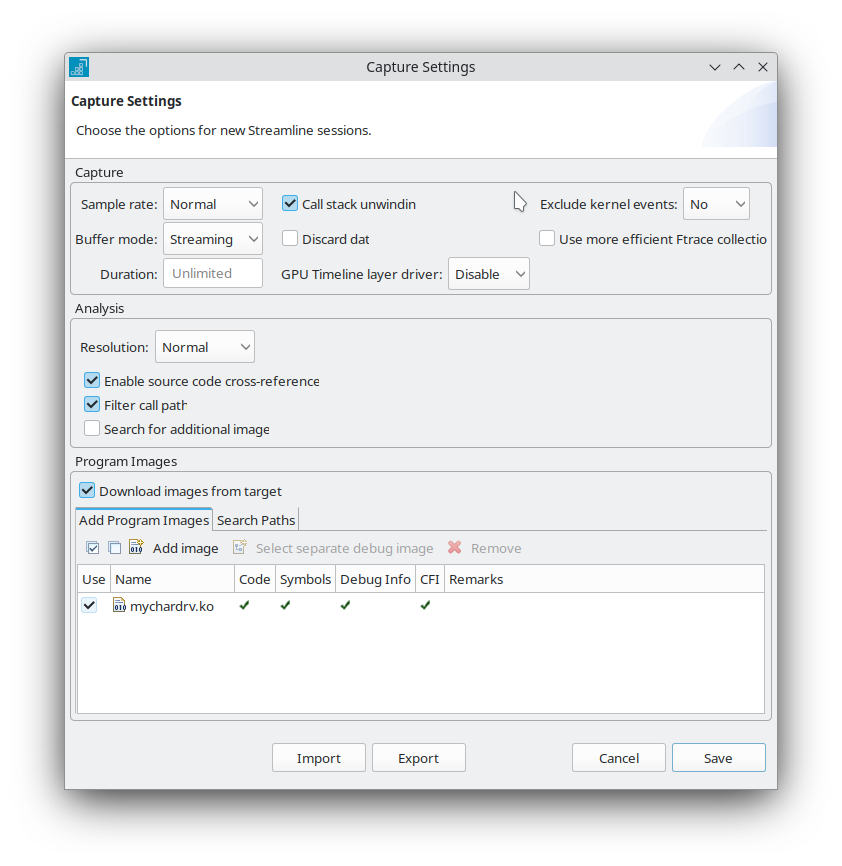 Add kernel module image in capture settings
Start the capture and enter a name and location for the capture file. Streamline starts collecting data and the charts show activity being captured from the target.
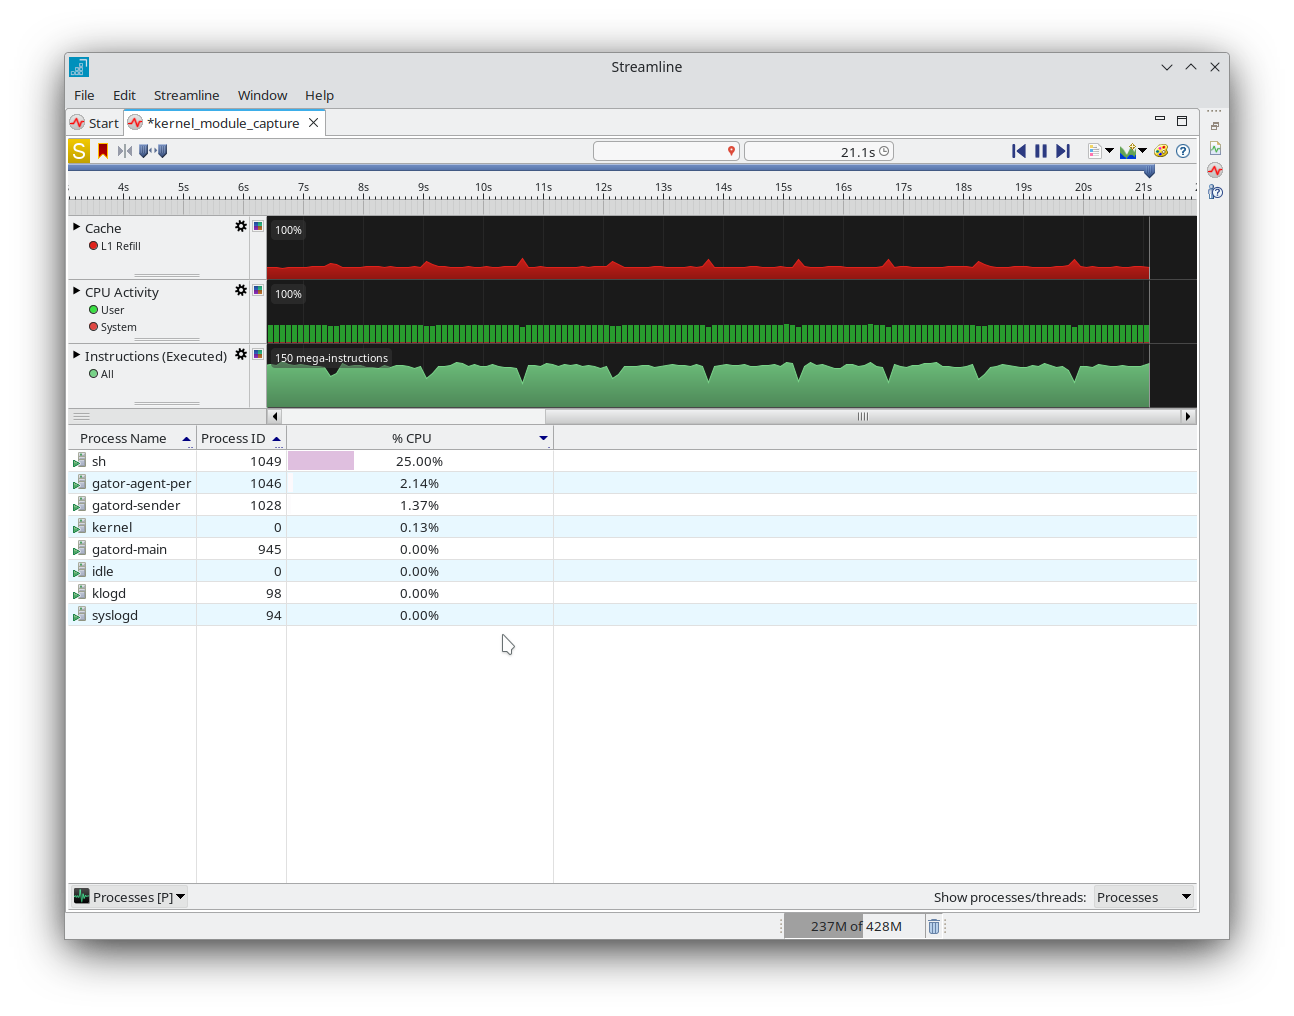 View timeline of captured performance data
Analyze the capture and inspect the code
Once the capture is stopped, Streamline automatically analyzes the collected data and provides insights to help you identify performance issues and bottlenecks. This section describes how to view these insights, starting with locating the functions related to our kernel module and narrowing down to the exact lines of code that may be responsible for the performance problems.
Open the Functions tab. In the counters list, select one of the counters you enabled earlier in the counter configuration dialog, as shown:
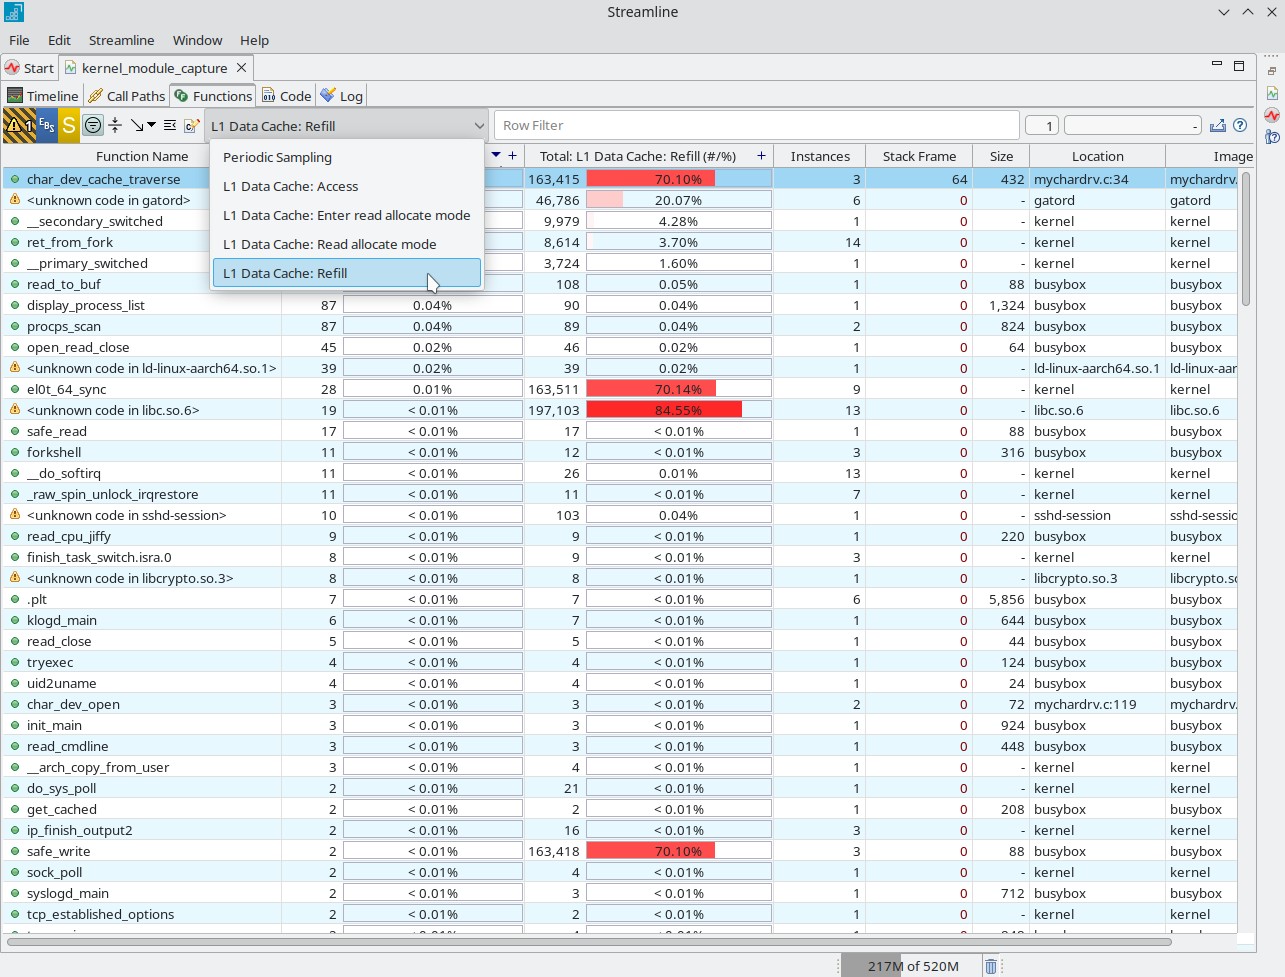 Select data source for counters
In the Functions tab, look for the function char_dev_cache_traverse(). You’ll see that it has the highest L1 Cache refill rate, which is expected for this example. Check the Image column on the right. This should show your module file name, mychardrv.ko. This confirms that Streamline is capturing performance data for your kernel module.
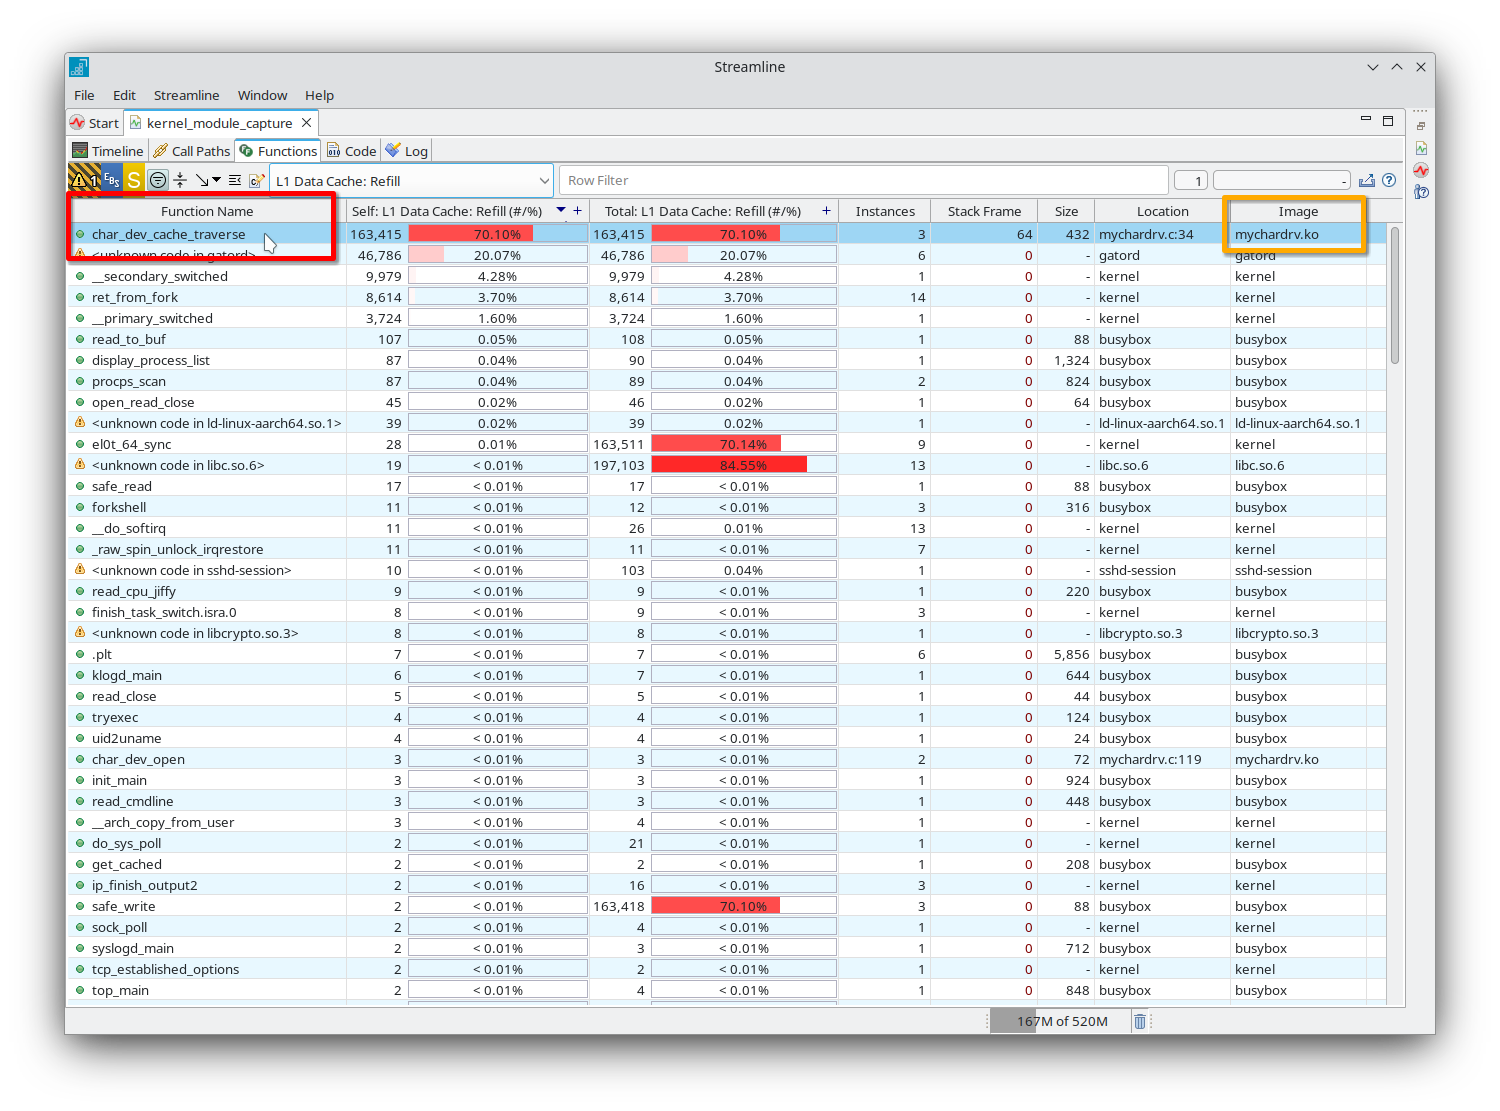 Identify functions with highest cache refill rates
To view the call path for char_dev_cache_traverse(), right-click the function name and select Select in Call Paths.
This opens the Call Paths tab, where you can trace which functions called char_dev_cache_traverse(). In the Locations column, you’ll see the sequence of calls which start from the userspace echo command and ending in your kernel module mychardrv.ko. This helps you understand how execution flows from userspace into your kernel code, making it easier to spot where performance issues might begin.
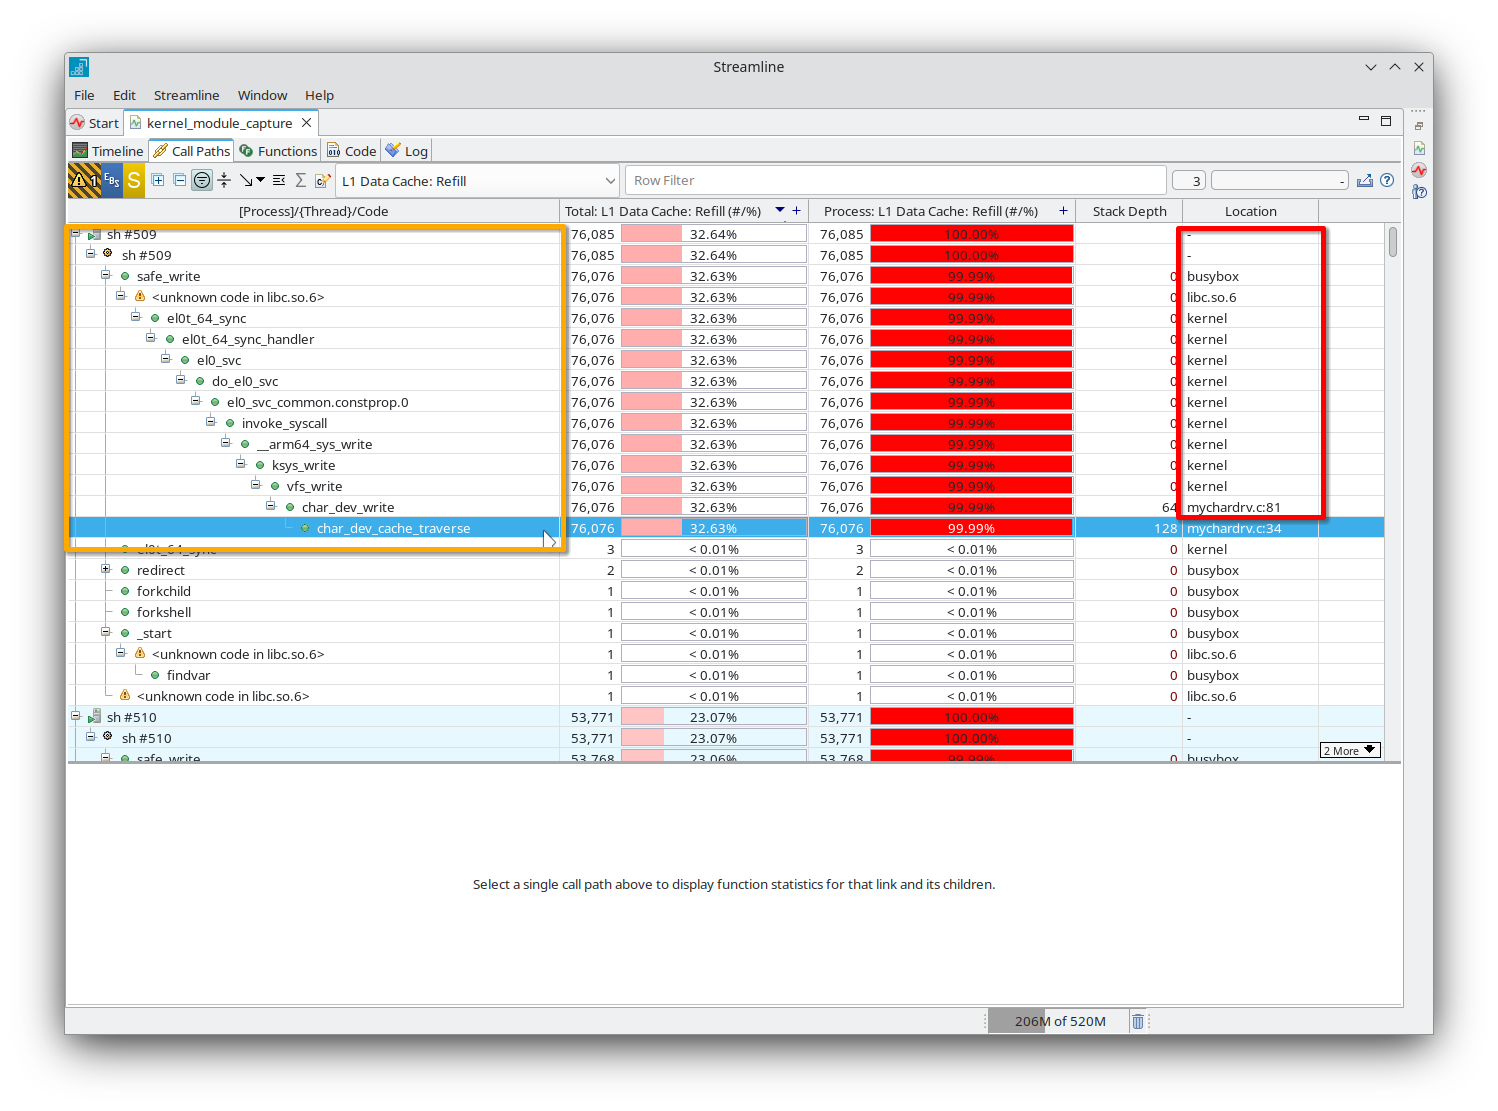 Trace function call paths in Streamline
Because you built your kernel module with debug information, Streamline highlights the exact lines of code that cause cache misses. This makes it easy to see which parts of your code need optimization.
Double-tap the function name to open the Code tab. The top section highlights each line of your source code and shows the number of cache misses for each line. The bottom section displays the matching assembly instructions, with counter values for every instruction. This clear view helps you quickly identify which parts of your code are causing performance issues.
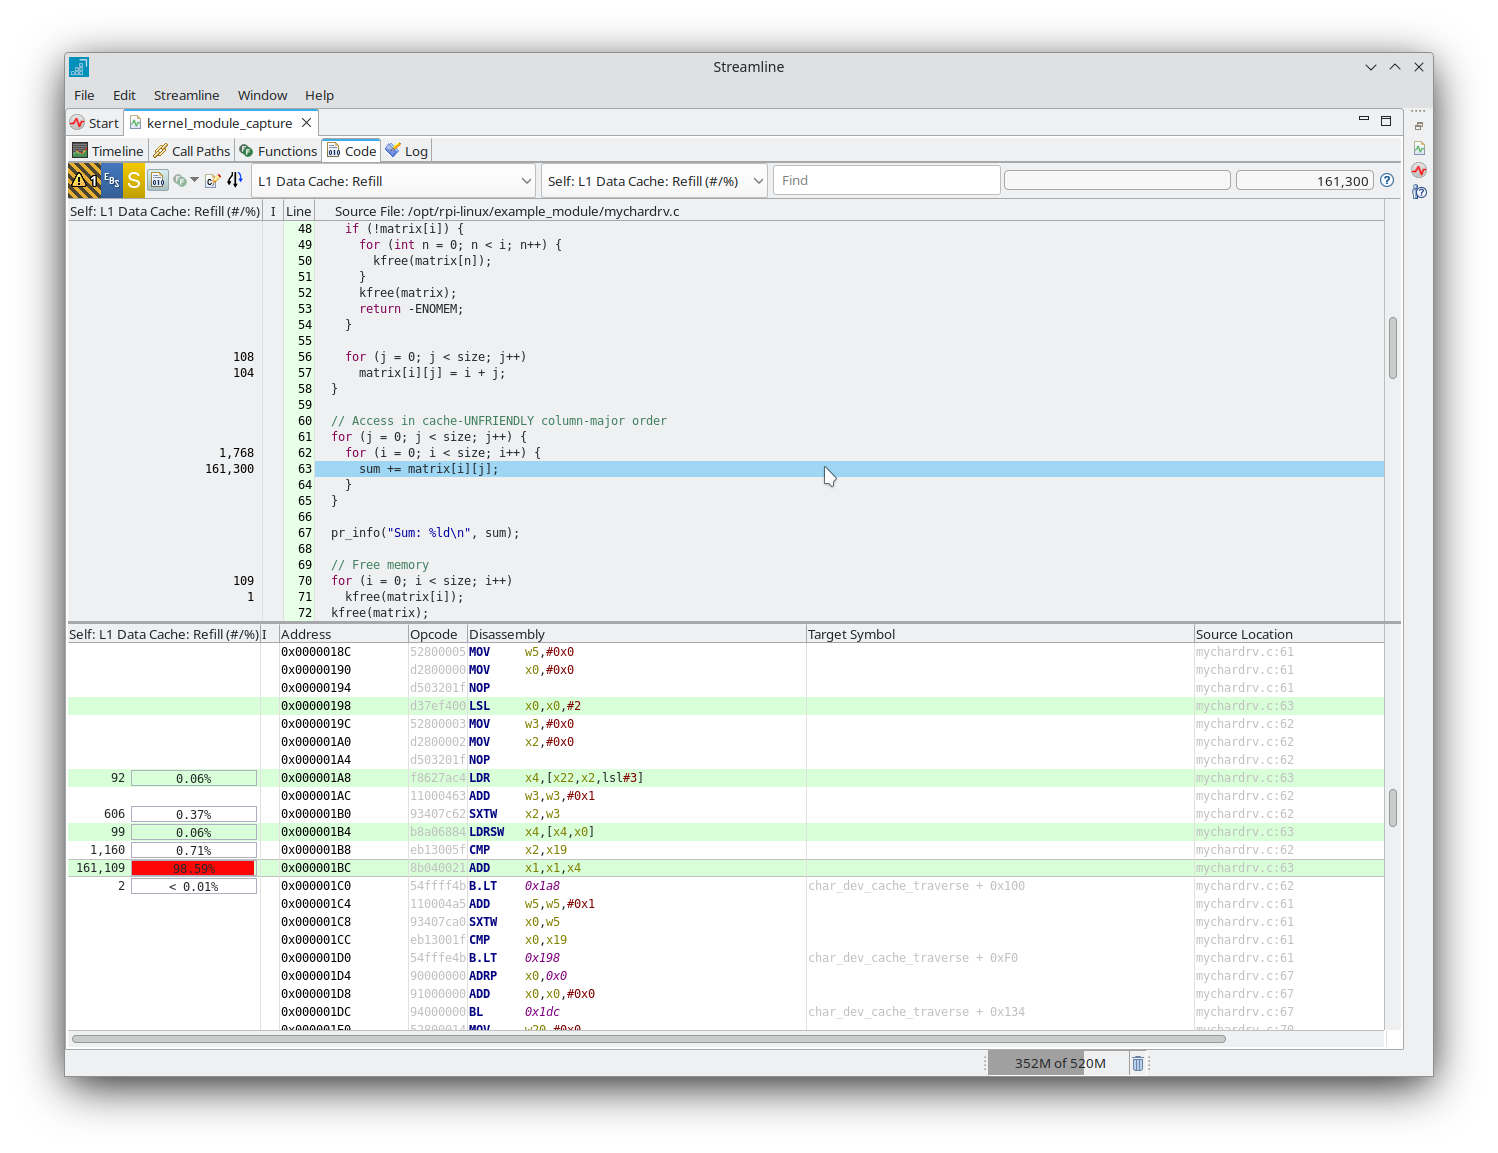 Analyze code and disassembly for cache misses in Streamline
You might need to configure path prefix substitution in the Code tab to view the source code correctly. For information on how to set this up and for more information about code analysis, see the Streamline User Guide .