Debug Trusted Firmware-A and the Linux kernel on Arm FVP with Arm Development Studio
Introduction
Introduction to Arm Fixed Virtual Platforms (FVPs)
Configure Trusted Firmware-A build flags to include cpu_ops support
Modify the device tree for CPU FVPs
Run the Linux software stack on an FVP
Debug the software stack
Next steps
Debug Trusted Firmware-A and the Linux kernel on Arm FVP with Arm Development Studio
Debug the software stack with Arm Development Studio
Once your software stack is running on the FVP, you can debug Trusted Firmware-A and the Linux kernel using Arm Development Studio (Arm DS).
Install Arm Development Studio
Download and install the latest version from the Arm Development Studio download page .
DWARF 5 is enabled by default in GCC 11 and later. Arm DS v2022.2 or later is recommended to support DWARF 5 debug information.
Launch Arm DS:
/opt/arm/developmentstudio-2022.2/bin/armds_ide
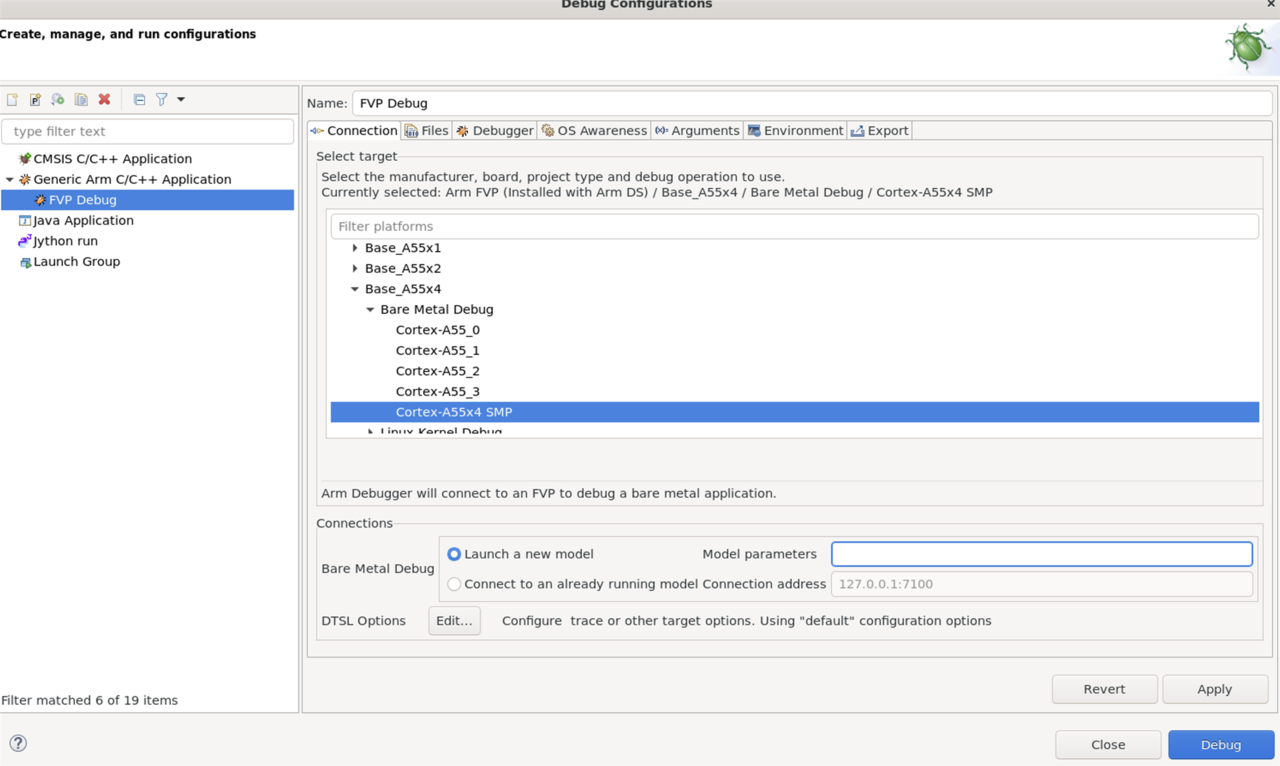
Create a debug configuration
To create a debug configuration, follow these steps:
- Open Arm DS, go to Run > Debug Configurations.
- Select Generic Arm C/C++ Application and create a new configuration.
- In the Connection tab:
- Choose your FVP model (for example, Base_A55x4)
- Enter model parameters:
        -C pctl.startup=0.0.0.0 \
-C bp.secure_memory=0  \
-C cache_state_modelled=0 \
-C bp.ve_sysregs.mmbSiteDefault=0 \
-C bp.ve_sysregs.exit_on_shutdown=1 \
-C bp.pl011_uart0.untimed_fifos=1 \
-C bp.pl011_uart0.unbuffered_output=1 \
-C bp.pl011_uart0.out_file=<PATH_TO_LOG>/uart0.log \
-C bp.pl011_uart1.untimed_fifos=1 \
-C bp.pl011_uart1.unbuffered_output=1 \
-C bp.pl011_uart1.out_file=<PATH_TO_LOG>/uart1.log \
-C bp.secureflashloader.fname=<SRC_PATH>/output/aemfvp-a/aemfvp-a/tf-bl1.bin \
-C bp.flashloader0.fname=<SRC_PATH>/output/aemfvp-a/aemfvp-a/fip-uboot.bin \
-C bp.virtioblockdevice.image_path=<SRC_PATH>/output/aemfvp-a/components/aemfvp-a/grub-busybox.img \
--data cluster0.cpu0=<SRC_PATH>/output/aemfvp-a/aemfvp-a/Image@0x80080000 \
--data cluster0.cpu0=<SRC_PATH>/output/aemfvp-a/aemfvp-a/fvp-base-revc.dtb@0x83000000
Load debug symbols
In the Debugger tab:
- Select Connect only to the target.
- Enable Execute debugger commands, and add:
        add-symbol-file "~/arm/sw/cpufvp-a/arm-tf/build/fvp/debug/bl1/bl1.elf" EL3:0
add-symbol-file "~/arm/sw/cpufvp-a/arm-tf/build/fvp/debug/bl2/bl2.elf" EL1S:0
add-symbol-file "~/arm/sw/cpufvp-a/arm-tf/build/fvp/debug/bl31/bl31.elf" EL3:0
add-symbol-file "~/arm/sw/cpufvp-a/linux/out/aemfvp-a/defconfig/vmlinux" EL2N:0
Select Apply and then Close.
Start debugging
- In the Debug Control view, double-click your new configuration.
- Wait for the target to connect and the symbols to load.
- Set breakpoints, step through code, and inspect registers or memory.
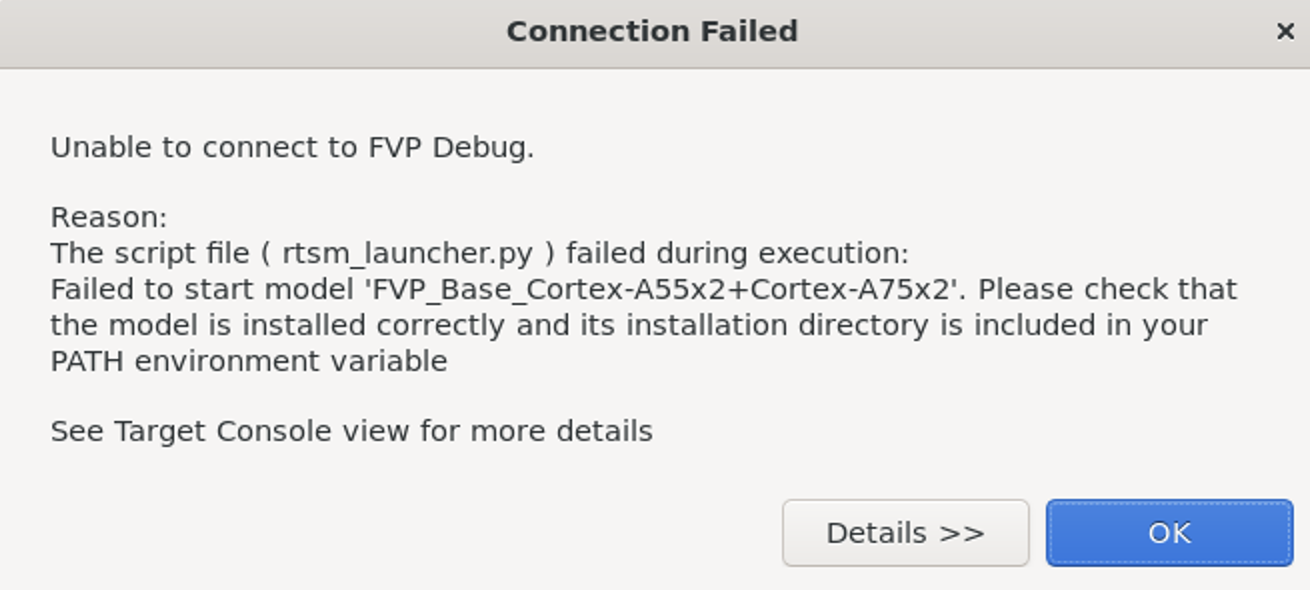
You might get the following error when starting the debug connection:
 Connection Failed error message
This means your Arm FVP is not provided by default in the Arm DS installation. Set the PATH in this case:
export PATH=<your model path>/bin:$PATH
Ensure your FVP instance is running and matches the model and parameters selected in Arm DS.
After these steps, you can debug the software stack as shown in the following figure:
 Debug interface in GUI