Analyze machine learning models for Arm Ethos-U with Arm ML Inference Advisor
Introduction
Understand where MLIA fits in model preparation
Install MLIA and discover capabilities
Analyze LiteRT artifacts with MLIA and Vela
Analyze TOSA IR artifacts with MLIA and Vela
Analyze ExecuTorch artifacts with MLIA and Corstone
(Optional) Use the MLIA Python API
(Optional) Use the MLIA and Model Explorer Visual Studio Code extension
Next Steps
Analyze machine learning models for Arm Ethos-U with Arm ML Inference Advisor
Introduction
Understand where MLIA fits in model preparation
Install MLIA and discover capabilities
Analyze LiteRT artifacts with MLIA and Vela
Analyze TOSA IR artifacts with MLIA and Vela
Analyze ExecuTorch artifacts with MLIA and Corstone
(Optional) Use the MLIA Python API
(Optional) Use the MLIA and Model Explorer Visual Studio Code extension
Next Steps
Open your model workspace in VS Code
You can use the Visual Studio Code (VS Code) extension for Arm ML Inference Advisor (MLIA) to move from a CLI view to using MLIA within your IDE. The extension also supports visualizing models in Model Explorer, with data from MLIA overlaid onto the model graphs.
If you completed the earlier steps on the same local machine, do the following:
- Open VS Code on the local machine.
- Select File > Open Folder.
- Open your
ml-model-artifactsdirectory.
If you completed the earlier steps on a remote Linux machine, connect to the machine using VS Code Remote - SSH . With Remote - SSH, the MLIA extension and analysis run on the remote host. Use the same SSH connection details that you used for the CLI steps:
- Install the Remote - SSH extension on the machine running VS Code.
- Open the Command Palette with Ctrl+Shift+P on Windows or Linux, or Cmd+Shift+P on macOS.
- Select Remote-SSH: Add New SSH Host.
- Enter your existing SSH command, including any key-file option such as
-i. For example, enterssh ubuntu@YOUR_HOST, replacing the user and host with your connection details. - Select an SSH configuration file when prompted.
 Add your Linux host to Remote - SSH
- Run Remote-SSH: Connect to Host and select the host that you added. Confirm that the VS Code status bar shows your SSH host.
- In the connected window, select File > Open Folder and open the remote
ml-model-artifactsdirectory.
After opening the ml-model-artifacts directory, install the MLIA extension and prepare its environment.
Install the MLIA extension and prepare its environment
Download the .vsix package from the latest
MLIA VS Code extension release
to your local machine.
In VS Code:
- If you’re using a remote Linux machine, connect to it with Remote - SSH first.
- Open the Extensions view.
- Select the … menu at the top of the view, then select Install from VSIX….
- Select the
.vsixfile that you downloaded to your local machine and install it.
If you’re connected over SSH, confirm that MLIA is installed and enabled on the SSH host as follows:
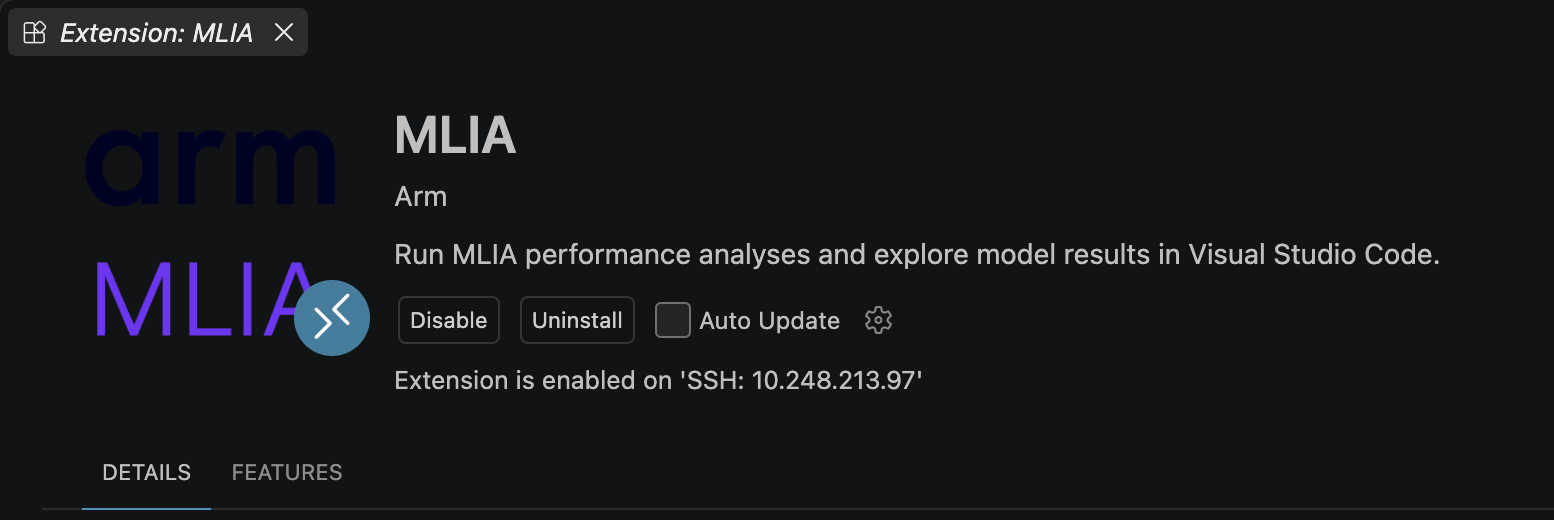 MLIA installed on the remote host
To set up the MLIA environment:
- Select MLIA in the Activity Bar.
- In New Analysis, select Refresh MLIA Environment and wait for setup to finish.
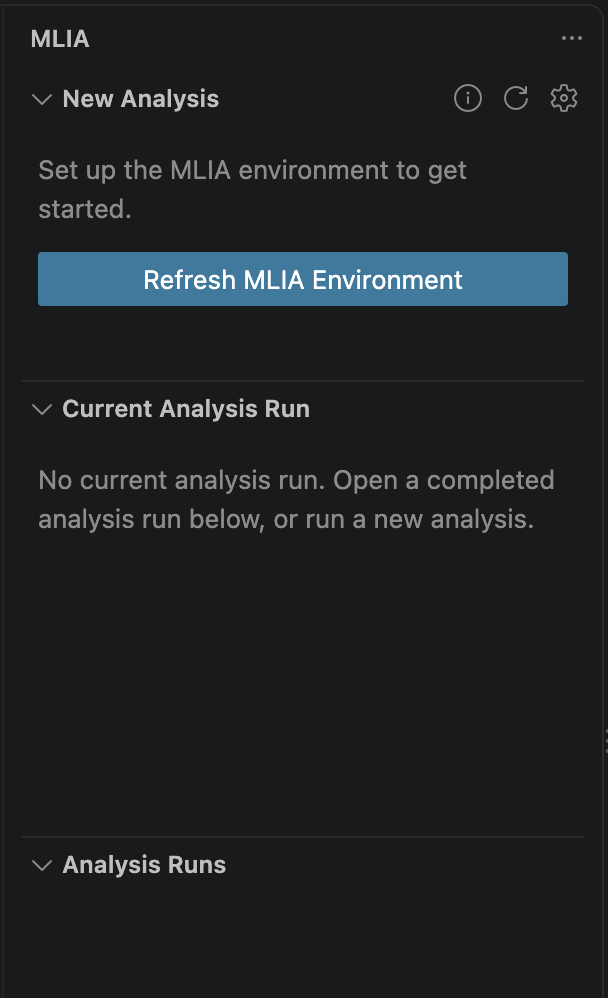 Create the managed MLIA environment
The extension installs and manages uv, Python, and MLIA in its own environment. You don’t need to activate mlia_env or install MLIA again for the extension. Its packages and backends are separate from the CLI environment that you created earlier.
Setup is complete when New Analysis shows the Estimation and Profiling tabs, a source-model field, and target-profile selection.
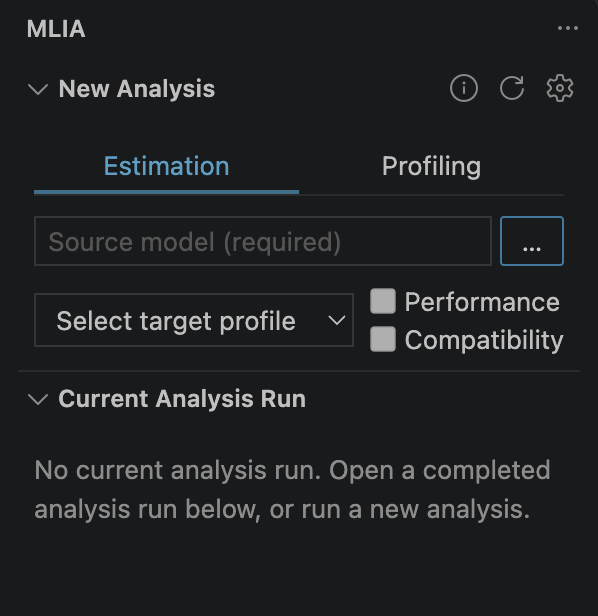 Analysis options after environment setup
Run an Ethos-U estimation for a TFLite model
In New Analysis:
- Select Estimation.
- Use the … button next to Source model to select
tflite/mv2_int8.tflitein yourml-model-artifactsfolder. - Select ethos-u85-256 as the target profile.
- Select both the Performance and Compatibility checkboxes.
- Select Run Analysis.
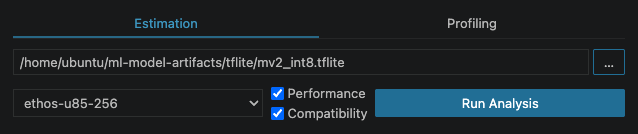 Select the model, target, and checks
Model Explorer opens with a loading view while the analysis runs. When it finishes, Current Analysis Run shows Complete, the model path, target profile, and selected checks. The completed-run screenshot confirms Performance + Compatibility.
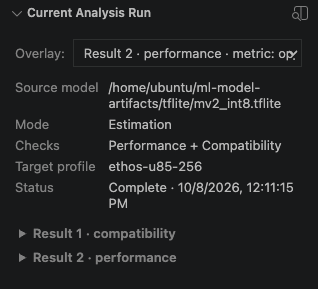 Confirm the analysis completed
Inspect compatibility and model performance
To inspect performance:
Expand Result 1 · compatibility > Model metrics. For this INT8 model, expect
accelerator_operator_percentageto be 100%, matching the earlier CLI check.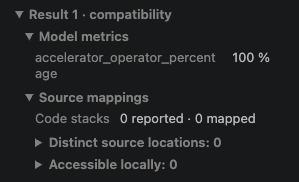 Inspect the compatibility result
Expand Result 2 · performance > Model metrics to inspect model-level cycle estimates, memory use, and estimated inference time.
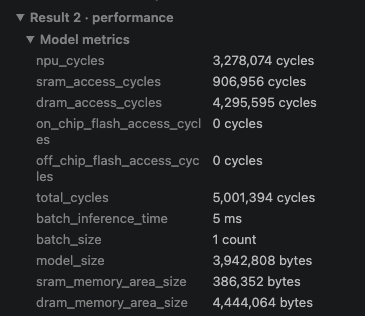 Inspect whole-model performance estimates
These LiteRT results come from Vela compiler estimates. The displayed inference time is an estimate, rather than latency measured on a board.
Explore operation metrics in Model Explorer
In Model Explorer, pan, zoom, and expand the model’s groups to inspect operations. Use the search box to locate a node by name.
Select a performance metric in the Overlay selector under Current Analysis Run. The corresponding values and colours appear on the graph. You can also select the overlay in Model Explorer, and the selection is synchronized with the sidebar.
The following image shows op_cycles.
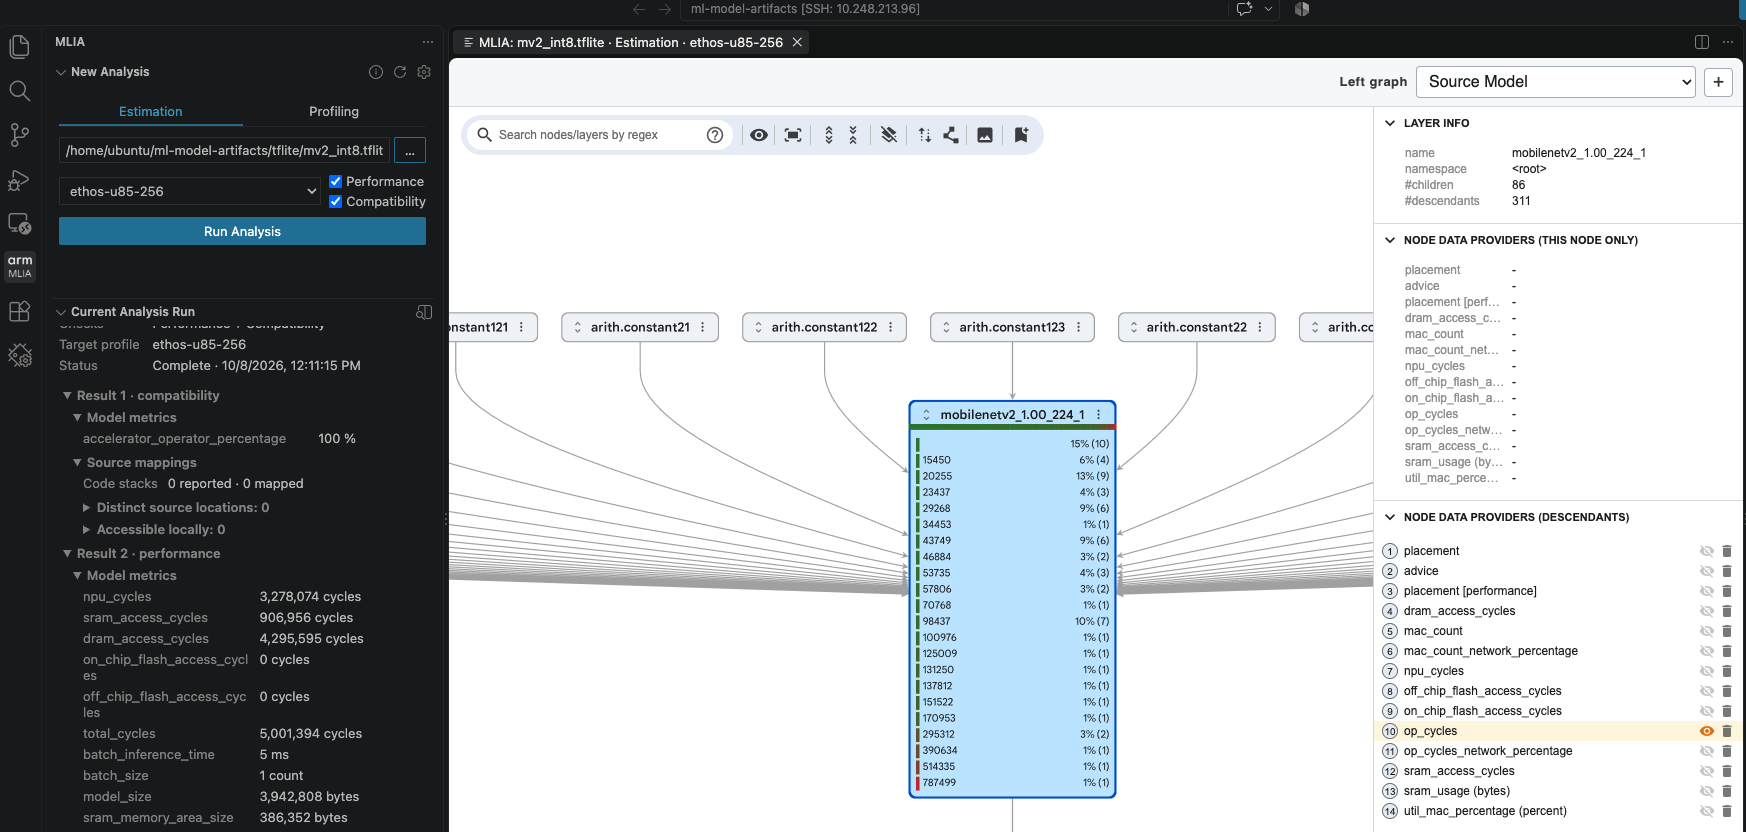 View analysis metrics on the source graph
Select a model group and inspect Node data in selected layer. Compare operation placement, npu_cycles, op_cycles, and memory-access metrics. Use the table filter to narrow the operations that you inspect.
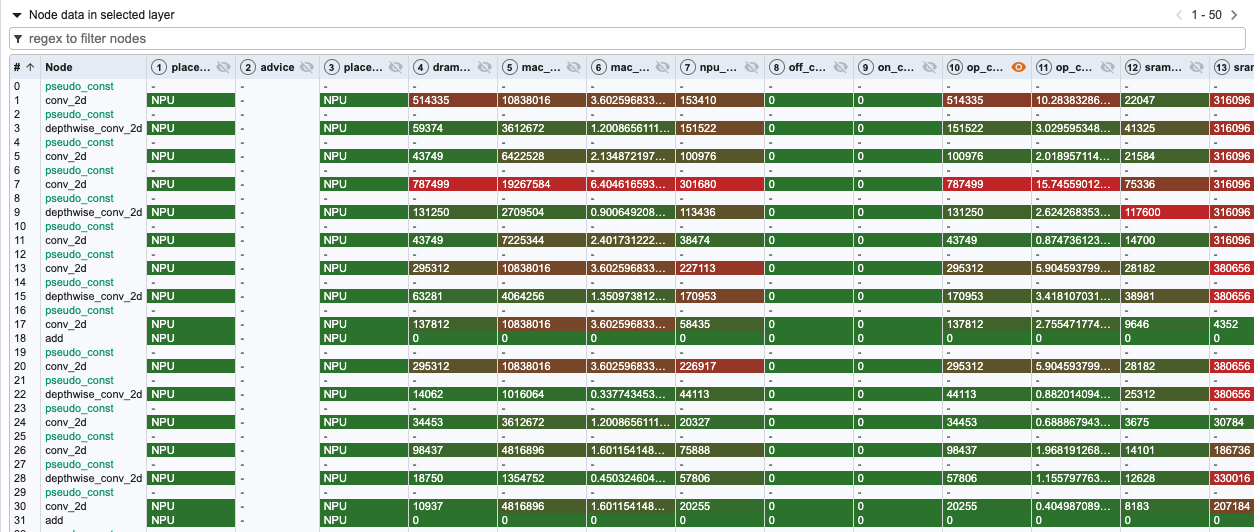 Compare metrics across operations
The Aggregated stats in selected layer table summarizes the available numeric metrics with minimum, maximum, sum, and average values. These summaries describe the selected graph group.
 Inspect metrics for a selected group
Use Model metrics for the whole-model result.
You can zoom in on the graph to see specific operators, with associated data overlaid. For example, to investigate memory cost, select the dram_access_cycles overlay. Expand a group and compare the values attached to its operations.
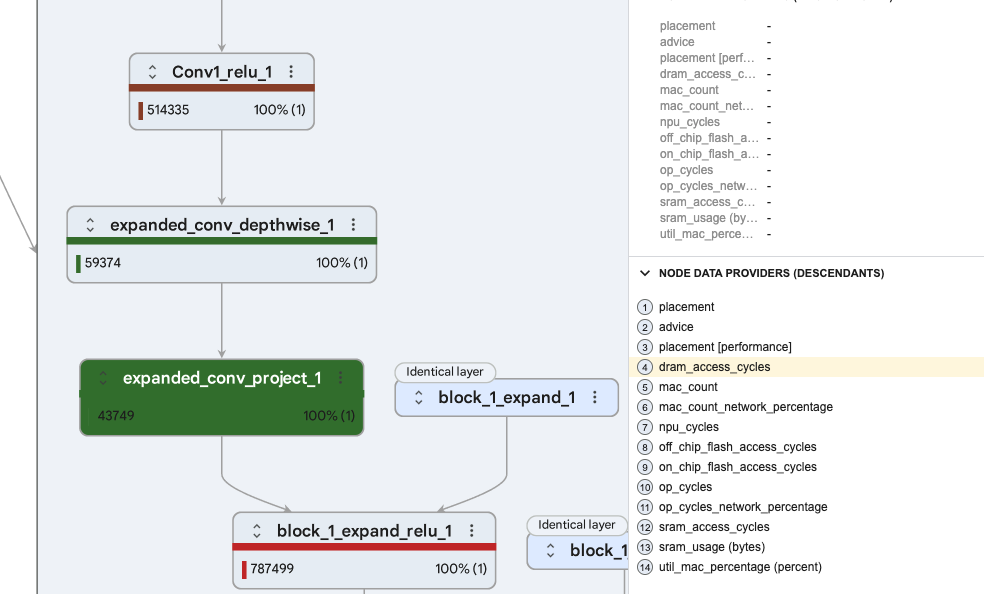 Explore DRAM access cycle estimates
Find advice on the model graph
Select advice as the overlay in Current Analysis Run or Model Explorer to highlight operations with MLIA advice. Select a highlighted operation to inspect its advice.
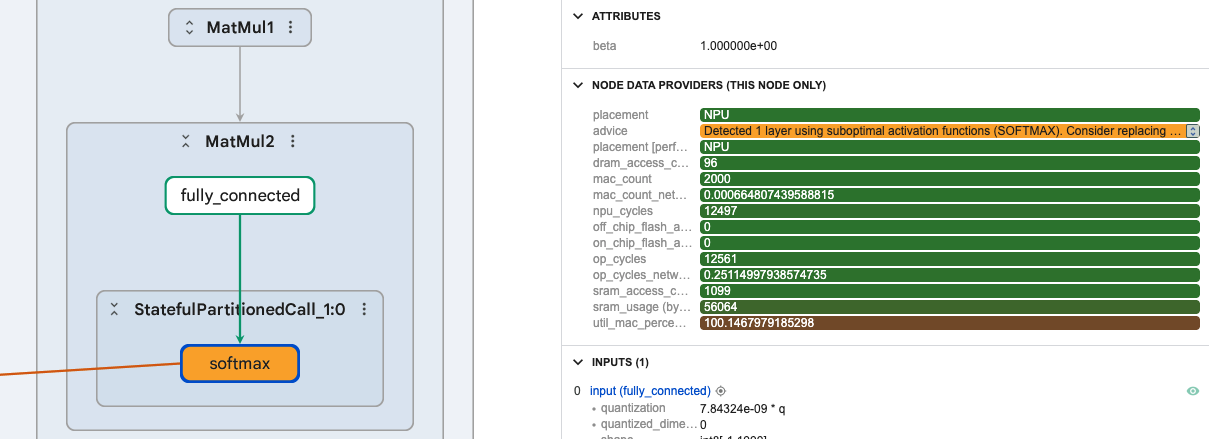 Locate the Softmax performance advice
The advice identifies SOFTMAX as a suboptimal activation for NPU performance. The operation is supported, so the model can still map fully to the NPU, but it’s a candidate for optimization. You can choose to change the model, after which you can rerun MLIA to compare compatibility and performance estimates. After a rerun, check whether the prediction accuracy and any required probability outputs still meet the needs of your application.
What you’ve accomplished
You’ve set up the MLIA extension, analyzed a model for Ethos-U, and inspected compatibility, model metrics, operation overlays, and advice in Model Explorer.
You can now use the same workflow to compare other supported model artifacts or investigate a revised model.