Tune Zenoh for ROS 2 traffic over wireless networks
Introduction
Understand ROS 2 sensor traffic constraints over wireless links
Prepare the system and measure the baseline
Tune Zenoh on an emulated wireless link
Measure Zenoh traffic policy effects with real Wi-Fi
Select a Zenoh deployment policy for ROS 2 over Wi-Fi
Next Steps
Tune Zenoh for ROS 2 traffic over wireless networks
Start the ROS 2 and Zenoh environment
You’ll tune the working system from Build a ROS 2 and Zenoh simulation environment on an Arm server and Distribute a ROS 2 robotic system across Arm devices with Zenoh . Ensure that you’ve completed installation and network configuration steps as described in these Learning Paths.
If the control and robot containers are stopped, start them from the Arm server host. Use the same working directory that you set up while completing
Build a ROS 2 and Zenoh simulation environment on an Arm server
:
cd ~/ros_zenoh
docker compose up -d
docker compose ps
The output is similar to:
        NAME                  STATUS
ros_zenoh-control-1   Up
ros_zenoh-robot-1     Up
Both services should report Up.
The commands that you ran in interactive terminals while completing the previous Learning Paths don’t restart with the containers. If the robot stack isn’t running, restart the robot stack.
Restart the robot stack
Each running container provides a browser-accessible desktop:
Robotcontainer desktop:http://<your_arm_server_ip_address>:6080/Controlcontainer desktop:http://<your_arm_server_ip_address>:6081/
If prompted for a password, enter ubuntu.
Open the robot container desktop and launch three terminals.
Run the router in the first terminal:
source ~/workshop_env.bash
just router
Run the simulation in the second terminal:
source ~/workshop_env.bash
just rox_simu no_gui
Run Navigation2 in the third terminal:
source ~/workshop_env.bash
just rox_nav2
Next, open the robot container desktop (http://<your_arm_server_ip_address>:6080/) in another browser tab or window.
After opening the robot container desktop, open a terminal and remove any network limit left by earlier tests:
source ~/workshop_env.bash
just network_normal
Understand the four measurements
Throughout this Learning Path, you’ll repeat the same measurements after every configuration change. Run all four at the same time so that every scenario creates the same network demand.
Using three separate terminals in the control container, run the following commands:
| Terminal | Command | Value to record |
|---|---|---|
| Control 1 | ros2 topic hz /scan | Average rate and standard deviation |
| Control 2 | ros2 topic hz /camera/image_raw | Average rate and standard deviation |
| Control 3 | ros2 topic bw /camera/points | Average bandwidth and message size |
In another terminal within the robot container, run the fourth measurement:
source ~/workshop_env.bash
just iftop_router
The command monitors traffic leaving the Zenoh router on TCP port 7447. Each remote ros2 topic process creates a separate connection, so you should see three active connections.
At the end of the display, iftop reports three TX rates. The output is similar to:
TX: rates: 813Mb 819Mb 832Mb
These values show the 2-second, 10-second, and 40-second moving averages of traffic sent by the robot. Record the middle value, which is the 10-second average.
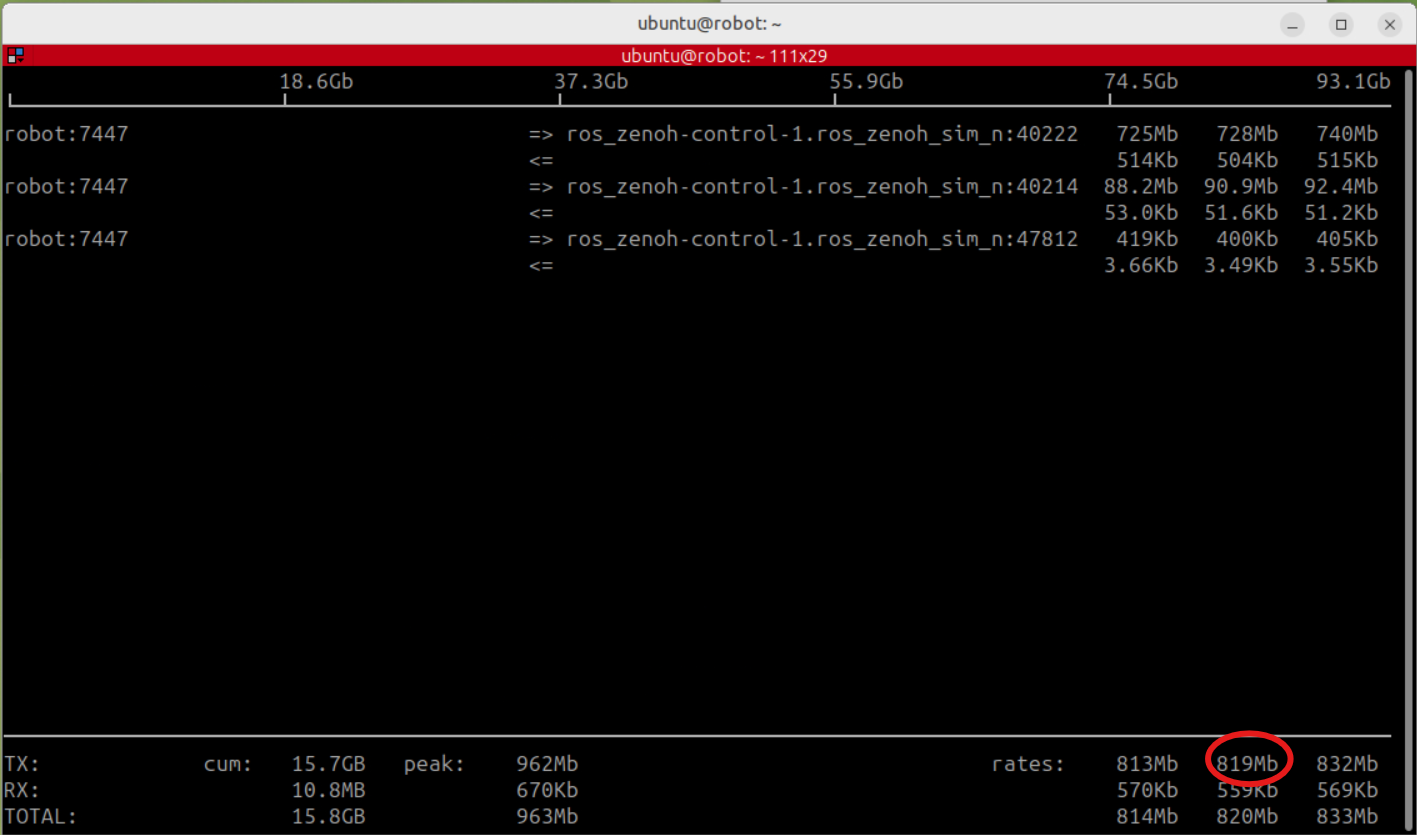 The circled middle TX value is the 10-second link rate
iftop reports bits per second, such as 819 Mbps. ros2 topic bw reports bytes per second, such as 92 MB/s. One byte contains 8 bits.
Record the baseline
Let all four measurements run for 60–90 seconds.
Expected result:
| Scenario | /scan | /camera/image_raw | /camera/points | Link traffic |
|---|---|---|---|---|
| Baseline | 7.97 Hz (std 0.115 s) | 11.85 Hz (std 0.035 s) | ~88 MB/s (7.37 MB per frame) | ~810 Mbps |
A typical baseline is approximately 8 Hz for /scan, 12 Hz for the image, 88–98 MB/s for the point cloud, and 800–820 Mbps of link traffic. Treat these as reference observations rather than pass or fail limits. Simulation speed and host performance affect the exact values.
Stop all four measurement commands with Ctrl+C. ROS 2 calculates these statistics cumulatively, so you must stop and restart the commands for each scenario.
What you’ve accomplished and what’s next
You’ve measured what reaches the remote receiver when the Docker link has enough capacity. This baseline is the reference for every later result.
Next, you’ll constrain the link and observe which topics survive.