Identify performance bottlenecks in ExecuTorch models
This Learning Path provides a hands-on, reproducible workflow for analyzing ExecuTorch model performance on Arm-based devices and identifying optimization opportunities after enabling SME2 acceleration.
When SME2 acceleration is enabled, inference latency often improves significantly. More importantly, faster compute exposes how execution time is distributed across the rest of the model.
Model inference time is typically spent in several broad operator categories: matrix compute (convolution and GEMM), non-linear operations (elementwise activations, normalization), and data movement (transpose, reshape, layout conversion, memory copies). In many models, matrix compute dominates latency, making it the primary bottleneck.
SME2 accelerates CONV and GEMM operations, often by 3× to 15×, removing the primary compute bottleneck. Once compute is faster, data movement costs become visible and can emerge as the next dominant contributor to latency.
End-to-end latency alone tells you that a model is faster, but not why or where time is still spent. Operator-level profiling reveals how execution time shifts across categories when SME2 is enabled, making it clear which operations to optimize next.
Build a model-agnostic performance analysis pipeline
In this Learning Path, you will construct a model-agnostic performance analysis pipeline for ExecuTorch models running on Arm-based devices:
- Export any PyTorch model to ExecuTorch
.pteformat - Run the same model with SME2 enabled and disabled for an apples-to-apples comparison
- Collect ETDump traces with operator-level timing
- Aggregate operators into high-level categories (CONV, GEMM, Data Movement, Elementwise, Other)
- Identify where bottlenecks move after SME2 acceleration
Once you have a .pte file, the same pipeline and commands apply to any model. Only the export step is model-specific.
Clone the profiling repository
All profiling and analysis steps in this Learning Path use a single, shared code repository. This repository contains the scripts, configuration, and example models for exporting ExecuTorch models, running profiling with SME2 enabled and disabled, and analyzing the resulting performance data.
You will use the sme-executorch-profiling repository throughout this Learning Path. The repository includes an example model (small convolutional neural network designed for testing and validation purposes), predefined ExecuTorch runners, and scripts for profiling, trace collection, and analysis.
Clone the performance analysis kit repository:
mkdir -p ~/sme2_analysis_work
cd ~/sme2_analysis_work
git clone https://github.com/ArmDeveloperEcosystem/sme-executorch-profiling.git executorch_sme2_kit
cd executorch_sme2_kit
This creates a self-contained workspace. Your Python virtual environment, ExecuTorch build outputs, models, and profiling runs will all live under this directory.
Understand the ExecuTorch execution stack with XNNPACK and KleidiAI
Before running the pipeline, it helps to understand how the execution stack is composed. The profiling results you generate reflect behavior across multiple layers. The diagram below summarizes the CPU execution stack used in this workflow.
 The execution stack: a model is defined in PyTorch, exported and run by ExecuTorch, and CPU compute is delegated to XNNPACK as the backend.
PyTorch to ExecuTorch export
Models are defined using standard PyTorch APIs and exported to a .pte (Portable ExecuTorch Executable) format. During export, you specify backend delegation (in this case, XNNPACK) which determines which operators the backend executes at runtime.
ExecuTorch runtime and delegation
At runtime, ExecuTorch schedules operators and delegates supported operations (such as Conv2d and Linear) to XNNPACK. XNNPACK uses Arm KleidiAI kernels, which use SME2 acceleration on supported hardware. The delegation is transparent to you as the model author.
Why operator-level profiling matters
ExecuTorch’s ETDump captures timing for each operator in the execution graph. This makes backend behavior visible: which operators are delegated, which kernels are used, and how much time each operation consumes. Aggregating operators into categories shows where SME2 delivers gains and where non-compute costs dominate.
Run the profiling pipeline
This Learning Path supports profiling on both Android and macOS (Apple Silicon). Android represents real-world edge ML deployment, while macOS provides convenient developer learning and experimentation. The workflow is identical on both platforms; only the runner binaries differ.
Android runs provide the most representative performance results because they reflect real device constraints such as memory bandwidth, thermal behavior, and platform-specific scheduling. macOS is included to simplify learning the workflow and validating the pipeline before running on target devices.
The steps below walk through the full workflow end to end: setting up the environment, building ExecuTorch runners, running a profiling pass, and generating analysis artifacts.
Set up the environment and ExecuTorch
This step creates a Python virtual environment, clones and builds ExecuTorch, and installs all required dependencies.
bash model_profiling/scripts/setup_repo.sh
Build SME2-enabled and SME2-disabled runners
Build the ExecuTorch runner binaries used for profiling. You need both SME2-enabled and SME2-disabled runners to compare performance directly.
On macOS, the runners are built automatically.
On Android, set the ANDROID_NDK environment variable and install a compatible NDK before running this step.
bash model_profiling/scripts/build_runners.sh
Run a smoke test end to end
This step runs a complete smoke test of the pipeline. It exports a model, runs it through ExecuTorch, collects ETDump traces, and confirms that profiling data is generated correctly.
On macOS, the test runs locally. On Android, connect a compatible device via adb before running this command.
python model_profiling/scripts/run_quick_test.py
Inspect and analyze results
The pipeline automatically analyzes collected traces and generates CSV and JSON summaries. You don’t need to run analysis manually.
To rerun analysis or customize it, point the analysis script at a specific run directory:
python model_profiling/scripts/analyze_results.py --run-dir model_profiling/out_toy_cnn/runs/mac
After this step completes, you have operator-level timing data and aggregated operator-category breakdowns for SME2-on and SME2-off runs.
Review ETDump traces and profiling artifacts
Running the pipeline generates a consistent set of artifacts that capture both raw performance data and derived analysis results. The most important artifacts are the ETDump trace files, which contain operator-level timing information collected during execution. All higher-level summaries are derived from these traces.
The generated artifacts are listed below:
- Model artifacts
out_<model>/artifacts/<model>_xnnpack_fp16.pte(runnable ExecuTorch model)out_<model>/artifacts/<model>_xnnpack_fp16.pte.etrecord(optional; operator metadata for better attribution)
- Run artifacts
out_<model>/runs/<platform>/<experiment>/*.etdump(ETDump traces, the primary data source)out_<model>/runs/<platform>/<experiment>/*.log(runner stdout/stderr)out_<model>/runs/<platform>/<experiment>/*.csv(CSV files generated automatically by pipeline: timeline, operator stats)out_<model>/runs/<platform>/manifest.json(optional; run metadata for reproducibility)out_<model>/runs/<platform>/metrics.json(optional; summary latencies)out_<model>/runs/<platform>/<model_stem>_pipeline_summary.json(pipeline summary with robust statistics)out_<model>/runs/<platform>/<model_stem>_pipeline_summary.md(pipeline summary markdown)
- Analysis artifacts
out_<model>/runs/<platform>/analysis_summary.json(operator-category breakdown, generated automatically by pipeline)
Although multiple file formats are generated, the .etdump files are the authoritative data source. All analysis scripts operate on these traces.
Interpret SME2 performance results
After analyzing your artifacts, you’ll see two key insights: end-to-end latency improvements and the bottleneck shift. The case study below shows results from SqueezeSAM, an interactive image segmentation model, running on an SME2-enabled Android device. The performance analysis kit includes EdgeTAM’s image segmentation module as the example model, which is a more recent video-focused segmentation model that demonstrates advanced model onboarding patterns.
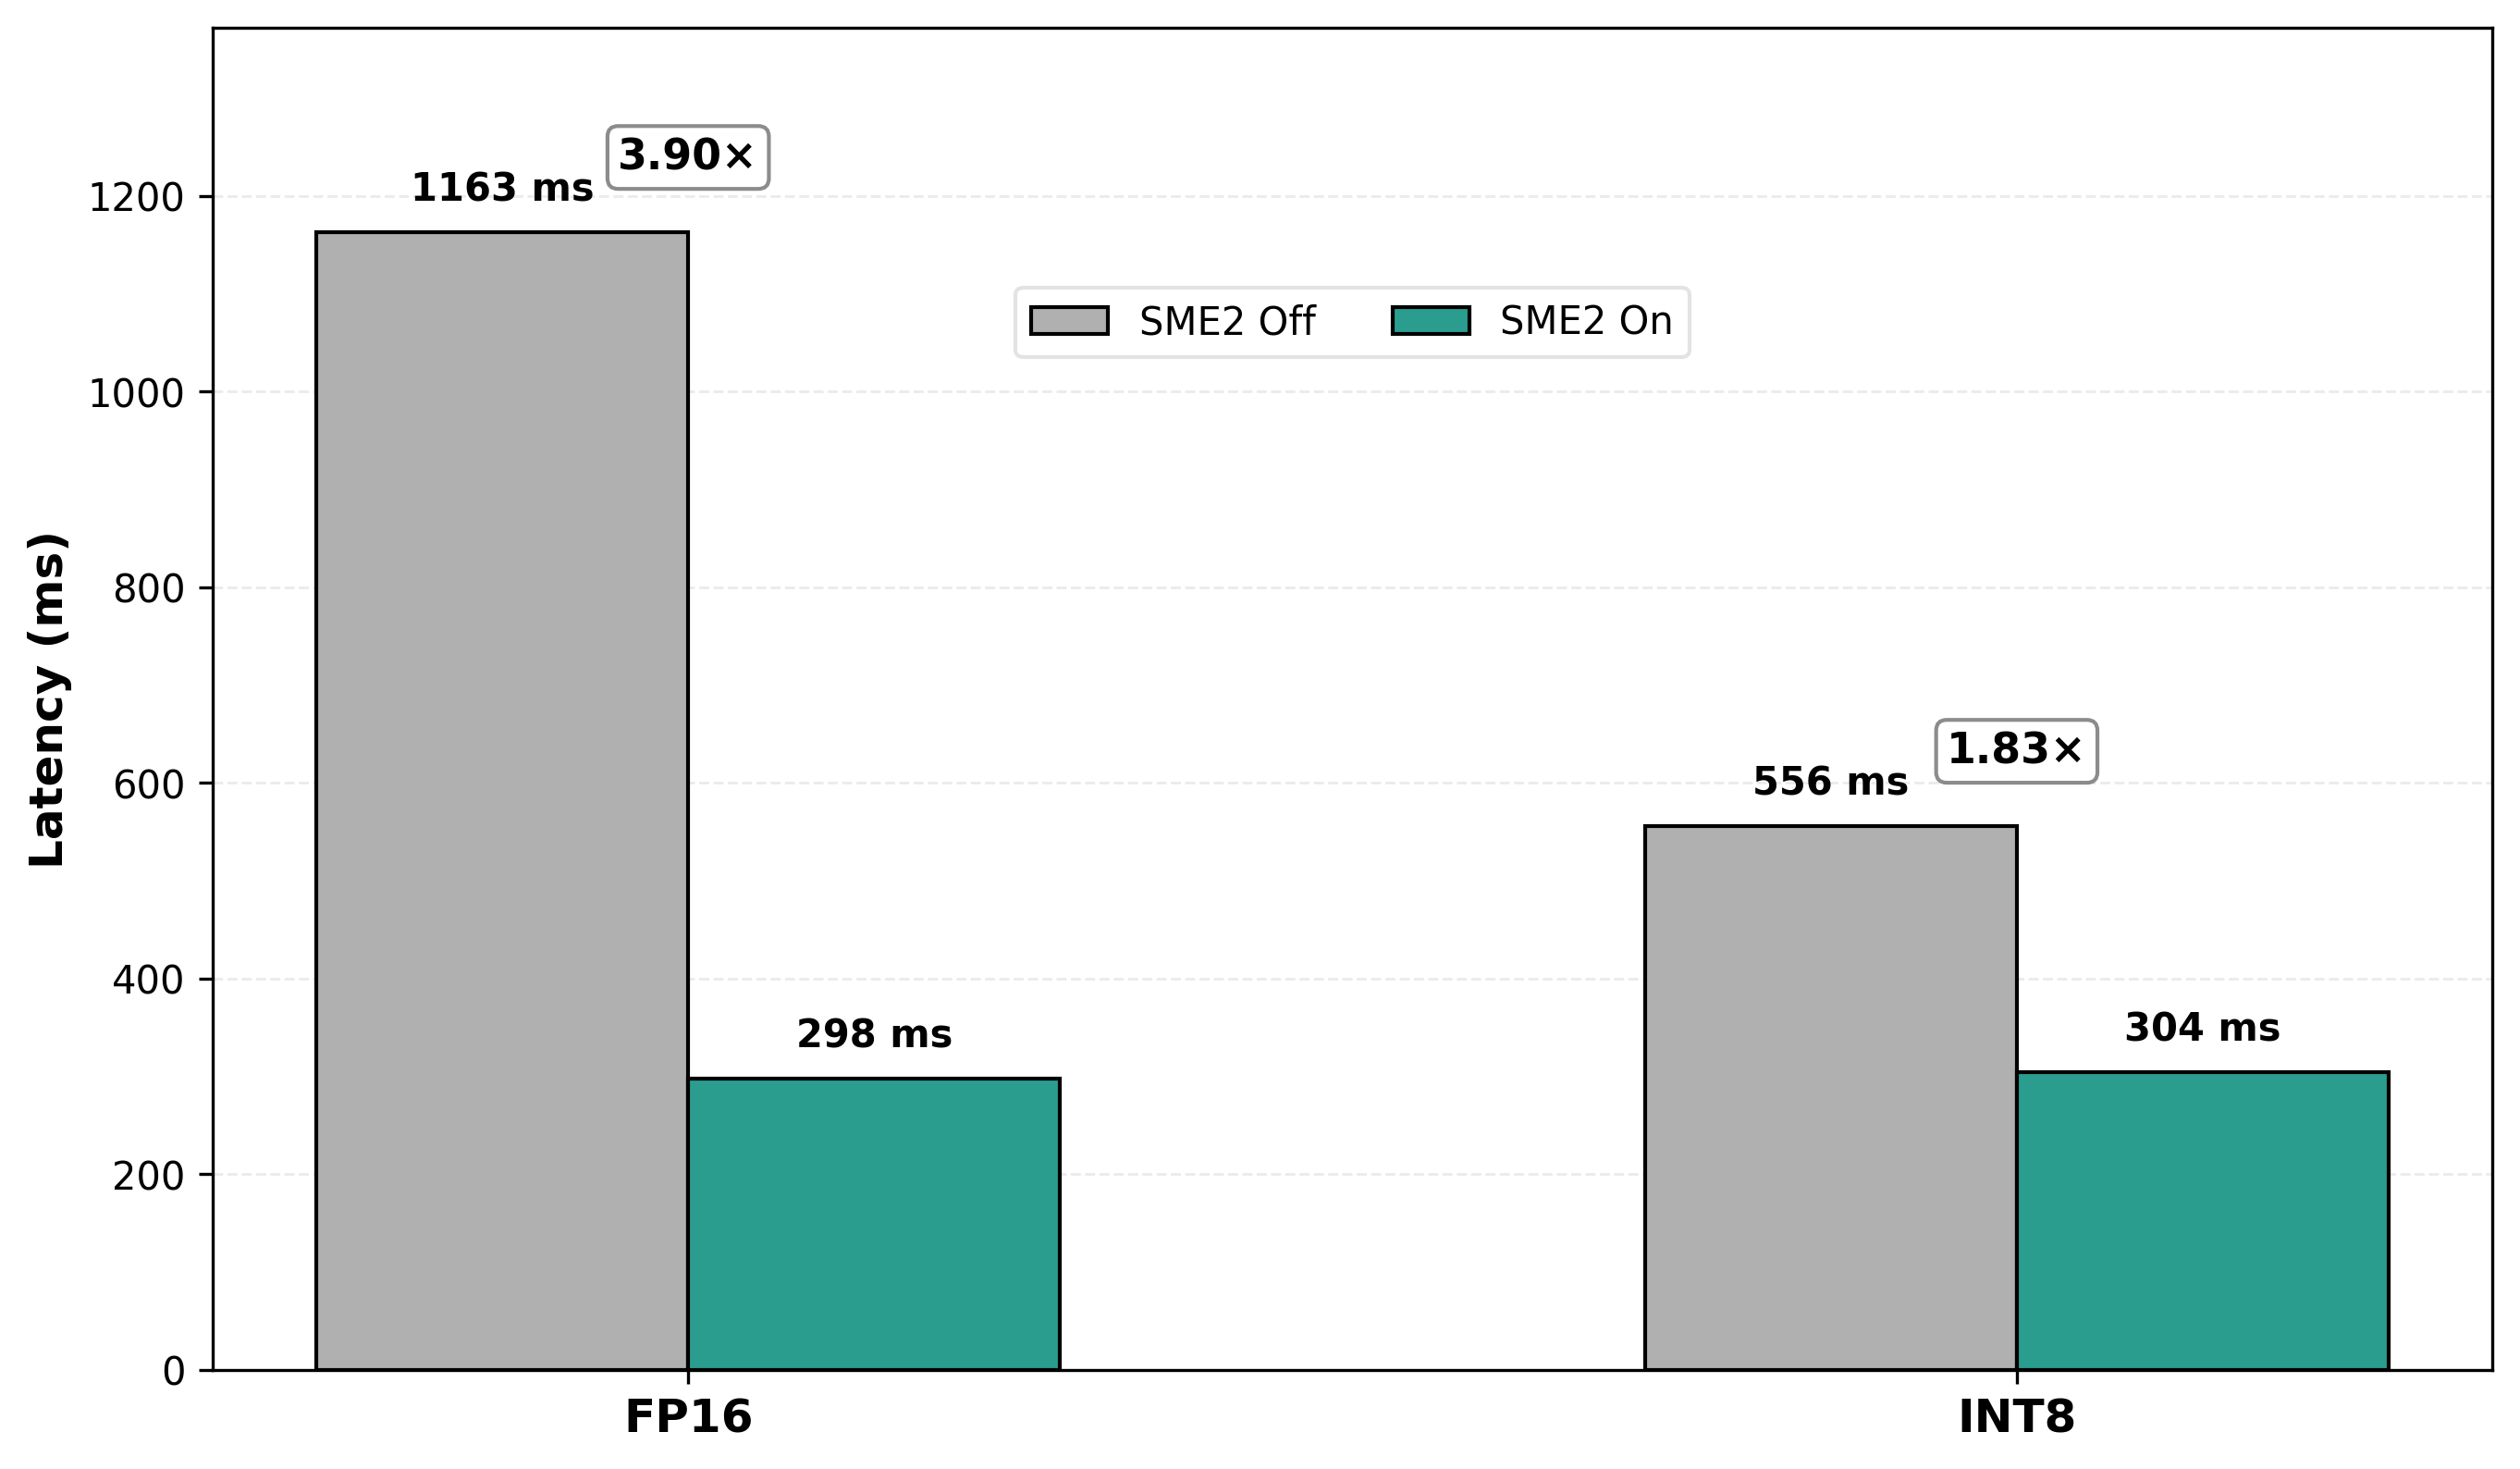
End-to-end latency: With SME2 enabled, FP16 inference improves by 3.9× (from 1,163 ms to 298 ms on a single CPU core), making on-device execution viable for interactive use cases. INT8 also sees substantial speedups (1.83×), demonstrating that SME2 accelerates both quantized and floating-point models.
SqueezeSAM on SME2-enabled Android device results:
 End-to-end latency comparison with SME2 on vs off
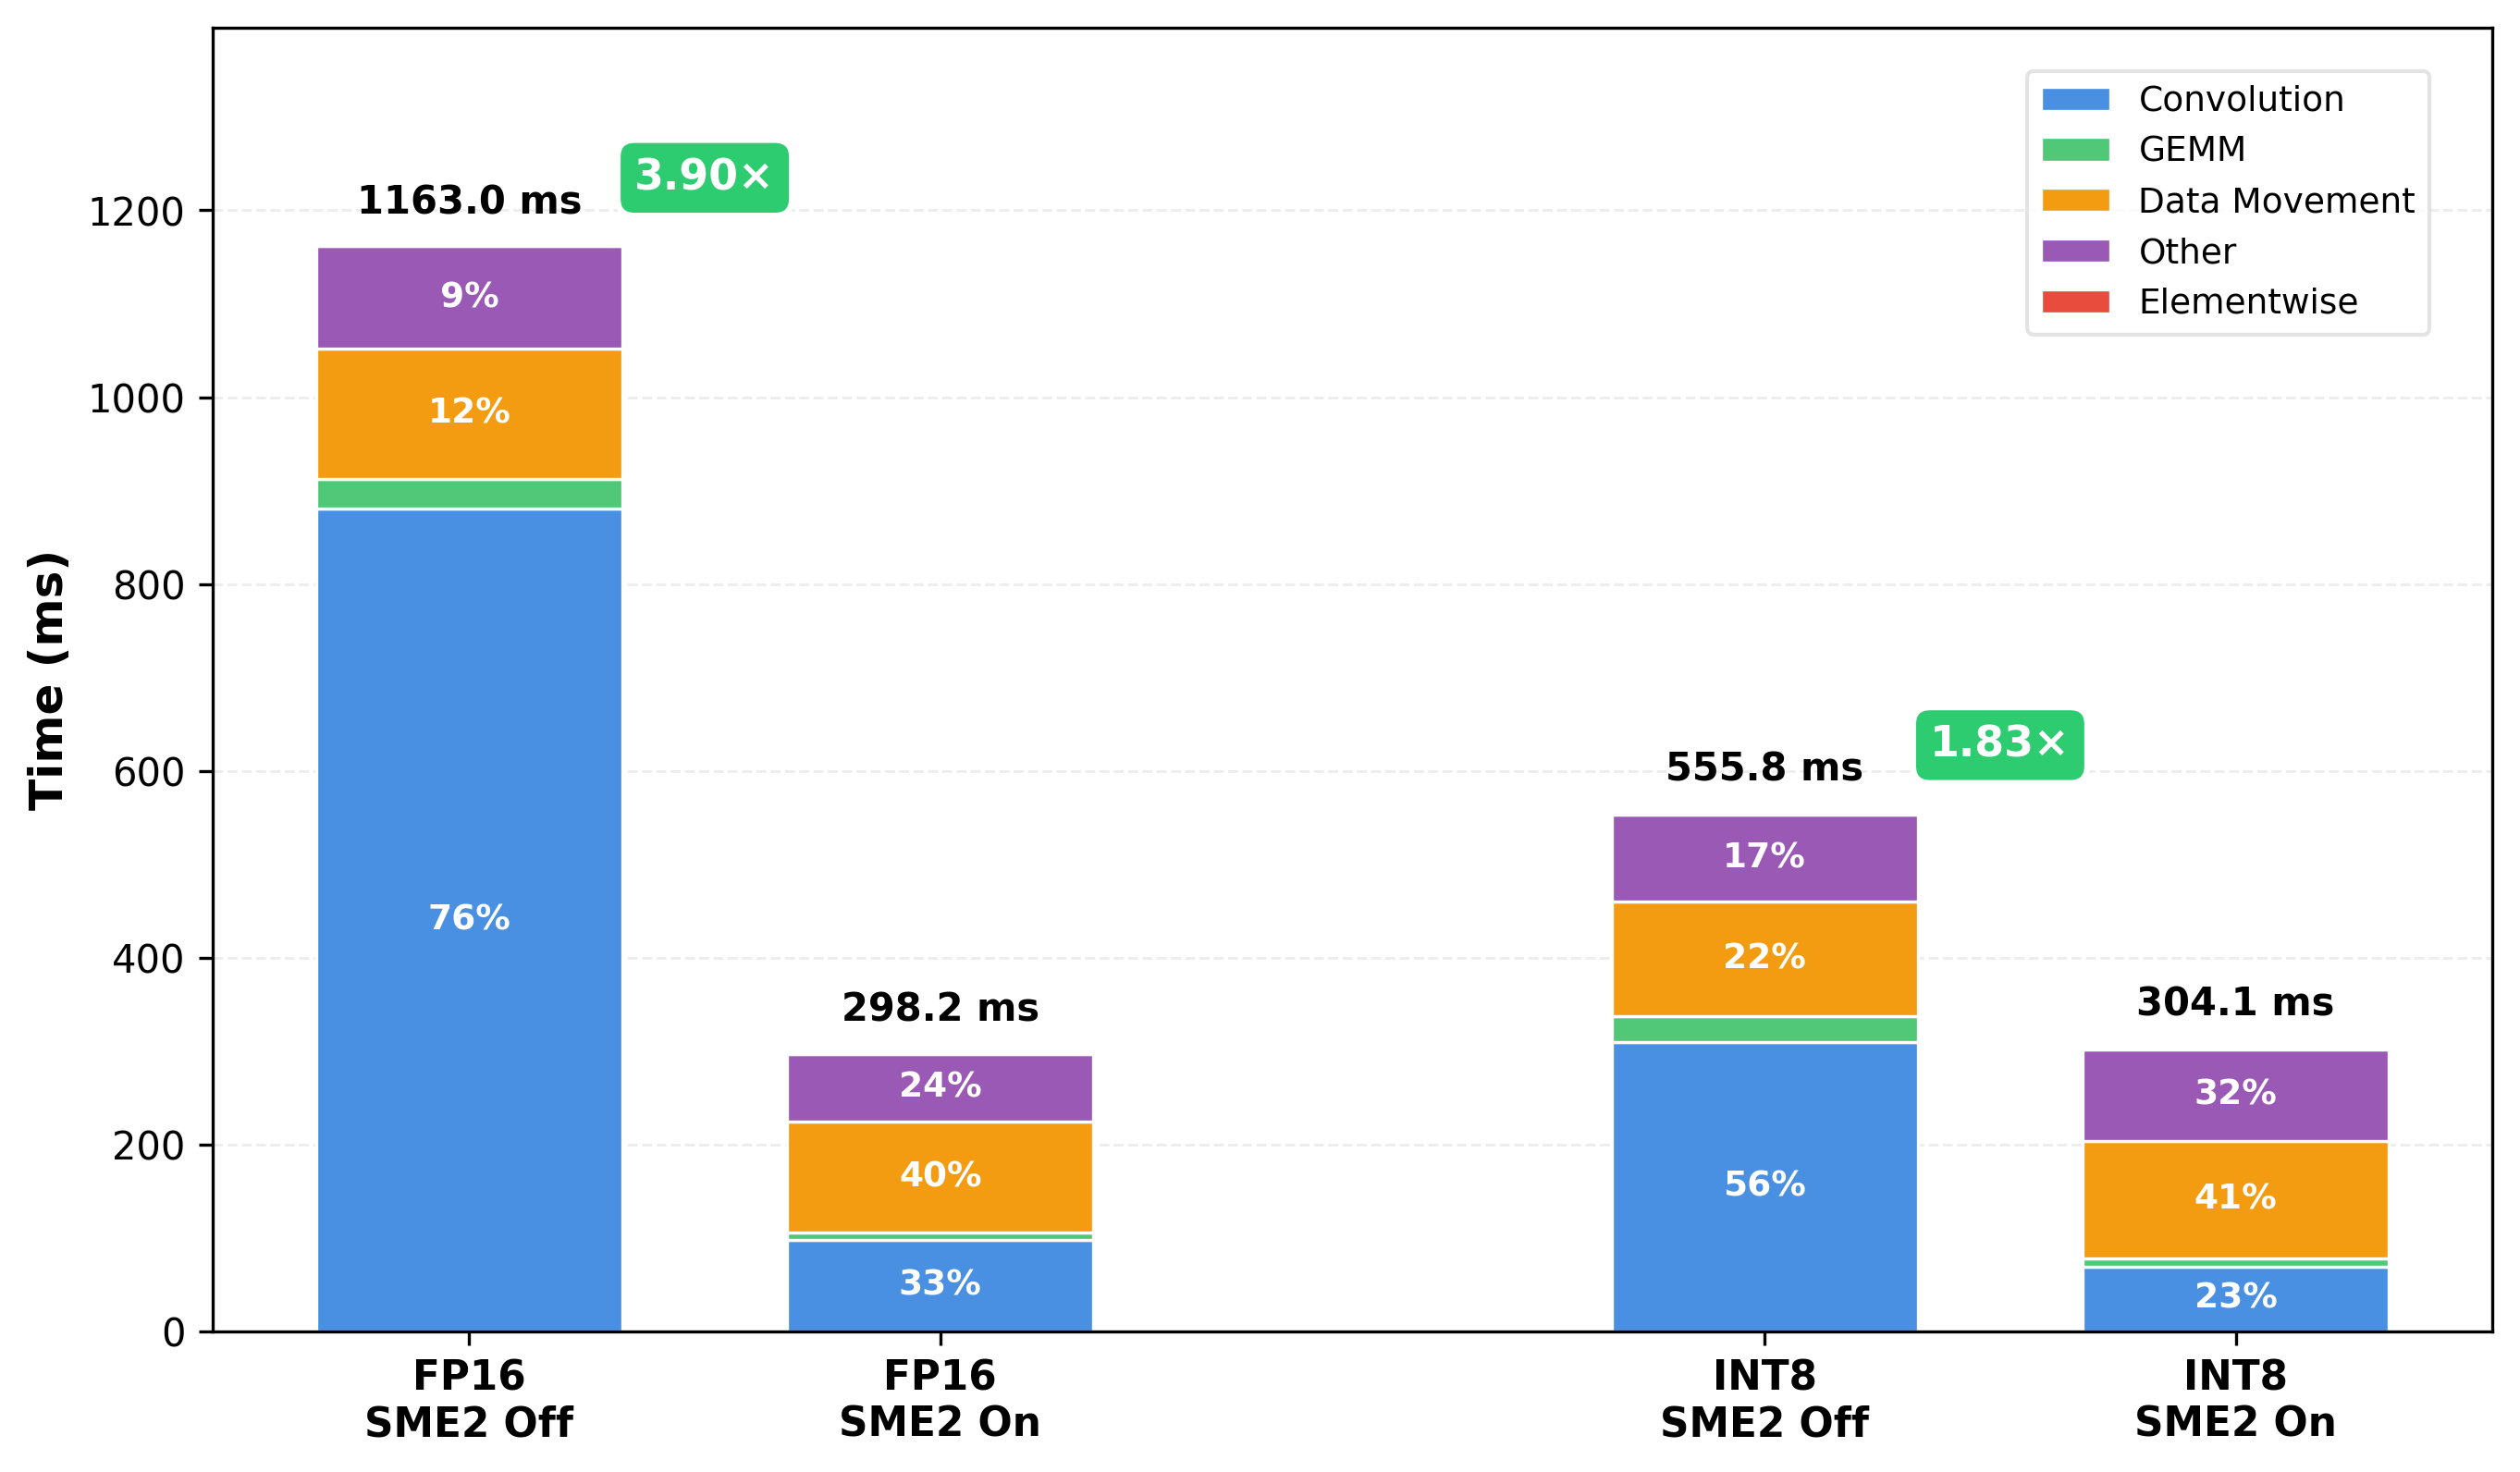
The bottleneck shift: After SME2 accelerates CONV and GEMM operations, data movement operations (transpose, reshape, layout conversions) become the dominant cost. This is expected, as SME2 reveals the next optimization frontier. The operator-category breakdown makes it obvious where to focus next.
 Operator-category breakdown showing data movement becoming dominant after SME2
The operator-category breakdown shows CONV/GEMM shrink while data movement becomes the dominant cost after SME2 acceleration. It makes it clear where further optimization effort should be focused once compute is no longer the limiting factor.
What you’ve accomplished and what’s next
You now understand the complete profiling workflow: how SME2 acceleration changes the performance profile of ExecuTorch models, what operator-level profiling reveals about bottleneck shifts, and how to interpret the results to guide optimization decisions.
The following sections walk through each stage of the pipeline in detail, from environment setup to model onboarding and automated workflows:
- Continue to Setup and pipeline to understand the environment setup and runner build process in more detail.
- Continue to Model onboarding and performance analysis to export additional models and analyze their performance.
- Continue to Agent skills to explore how this workflow can be automated using AI-assisted tooling.