Build a ROS 2 and Zenoh simulation environment on an Arm server
Introduction
Start the ROS 2 development containers
Configure Zenoh for ROS 2
Observe Zenoh router discovery behavior
Start the robot simulation and Navigation2
Visualize and navigate the robot with RViz
Control the Neobotix ROX robot with ROS 2
Observe ROS 2 simulation resource usage on an Arm server
Enable Zenoh shared-memory transport
Next Steps
Build a ROS 2 and Zenoh simulation environment on an Arm server
Introduction
Start the ROS 2 development containers
Configure Zenoh for ROS 2
Observe Zenoh router discovery behavior
Start the robot simulation and Navigation2
Visualize and navigate the robot with RViz
Control the Neobotix ROX robot with ROS 2
Observe ROS 2 simulation resource usage on an Arm server
Enable Zenoh shared-memory transport
Next Steps
Understand the measurements
The simulation runs Gazebo, Navigation2, Zenoh, and sensor-processing nodes in one container. You’ll use the following three workshop commands to see how this workload uses the Arm server:
just topdisplays CPU usage per workshop-user process with full command linesjust rt_factorreports Gazebo’s real-time factor, which is simulated time divided by wall-clock timejust iftop_loreports traffic on the loopback interface and excludes browser desktop traffic
These measurements establish a baseline before you enable shared-memory transport.
Run the monitoring commands
Run each command in turn. Press Ctrl+C to stop the current command before starting the next one:
just top
just rt_factor
just iftop_lo
Each command provides a different view of the workload:
- In
just top,gz simis multi-threaded and uses roughly two to three CPU cores on the supplied reference system. Its 20-core Arm server remains largely idle. - In
just rt_factor, a value near1.0means simulation time keeps pace with wall-clock time. A substantially lower value indicates that other workloads or the simulation are constraining the available CPU. - In
just iftop_lo, the reference system carries several hundred Mbps over TCP loopback, dominated by point-cloud data.
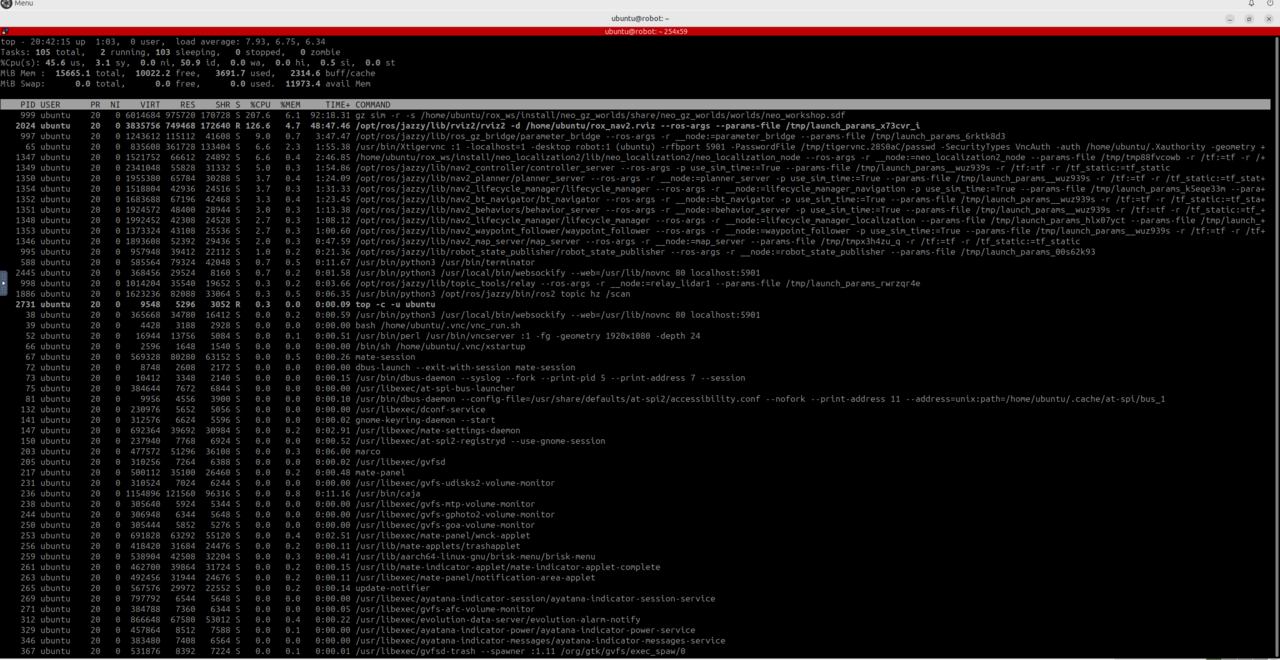
CPU load, real-time factor, and traffic levels depend on your Arm server and other running workloads. Treat the supplied figures as reference observations rather than guaranteed results.
Confirm that all three commands produce output. Record the loopback traffic shown by just iftop_lo so you can compare it with the shared-memory run.
What you’ve learned and what’s next
You’ve measured process load, simulation speed, and internal TCP traffic.
Next, you’ll move large local messages to Zenoh shared memory and repeat the latency and traffic observations.