Run and benchmark BitNet-2B inference on Arm CPUs with Litespark-Inference
Introduction
Understand Litespark-Inference and BitNet b1.58
Run BitNet-2B with Litespark-Inference
Benchmark Litespark-Inference on Arm
Next Steps
Run and benchmark BitNet-2B inference on Arm CPUs with Litespark-Inference
Record your benchmark configuration
The litespark-benchmark command measures memory use, time to first token
(TTFT), prompt prefill throughput, and token-generation throughput. Use it
to establish a performance baseline on Arm Linux or macOS on Apple silicon.
By default, the inference benchmark uses the torchless Litespark-Inference
runtime. It doesn’t run a PyTorch baseline unless you add the --pytorch flag.
Run the following commands from the virtual environment you created by following the Litespark-Inference install guide :
python -m pip show litespark-inference
litespark-inference info
Record the package version, CPU, active kernel, thread count, and embedding
data type with your results. Keep these values unchanged when comparing runs.
The active kernel should contain neon on Arm Linux and Apple silicon.
For consistent results, close CPU-intensive applications and run each test under similar system load and thermal conditions.
Run the benchmark on Arm Linux
Use nproc to set the benchmark to the number of available processing units:
litespark-benchmark \
    --inference \
    --no-matrix \
    --threads "$(nproc)" \
    --output results-arm-linux.json
Run the benchmark on macOS
On Apple silicon, use sysctl to obtain the number of logical CPUs:
litespark-benchmark \
    --inference \
    --no-matrix \
    --threads "$(sysctl -n hw.logicalcpu)" \
    --output results-macos.json
Both commands run the BitNet inference workload with 128 prompt tokens
(pp128) and 128 generated tokens (tg128). They use the default torchless
backend and INT4 embeddings. The terminal output reports memory, TTFT, and
throughput. The JSON file preserves the configuration and detailed results.
Compare with a PyTorch baseline
PyTorch is needed only when you add the --pytorch flag. The benchmark command doesn’t install PyTorch. The current PyPI package declares PyTorch and Transformers
as dependencies, so they’re already present after you follow the install
guide.
Verify that both packages are available in your virtual environment:
python -c "import torch, transformers; print(torch.__version__, transformers.__version__)"
On Arm Linux, add --pytorch to the benchmark command:
litespark-benchmark \
    --inference \
    --pytorch \
    --no-matrix \
    --threads "$(nproc)" \
    --output comparison-arm-linux.json
On macOS, run the equivalent comparison with the Apple silicon thread count:
litespark-benchmark \
    --inference \
    --pytorch \
    --no-matrix \
    --threads "$(sysctl -n hw.logicalcpu)" \
    --output comparison-macos.json
The PyTorch pass takes longer and uses substantially more memory than the torchless-only benchmark. When both passes complete, the terminal displays a comparison table for memory, TTFT, and throughput.
The following example output is from a 64-thread Arm Linux server. Results vary depending on the processor, thread count, and system load:
        ======================================================================
COMPARISON: Litespark vs PyTorch
======================================================================

Metric                      PyTorch    Litespark  Improvement
----------------------------------------------------------
Memory (MB)                   4,602          776         5.9x
TTFT (ms)                  10,370.1      1,609.1         6.4x
Throughput (tok/s)             1.83        17.75         9.7x
----------------------------------------------------------
Understand the benchmark flags
The following are the benchmark flags and the purpose they serve:
| Flag | Purpose |
|---|---|
--inference | To run the BitNet pp128 and tg128 inference workload |
--no-matrix | To skip the separate raw matrix-shape benchmark |
--threads N | To set the OpenMP thread count so runs use the same CPU resources |
--embed-dtype bf16, int8, or int4 | To select the token-embedding data type. The default is int4. |
--pytorch | To add the Hugging Face and PyTorch baseline. PyTorch isn’t used when you omit this flag. |
--output FILE | To save the configuration and results as JSON |
Measure thread scaling
Run the same benchmark with several fixed thread counts to see how prefill and
token generation scale. Change only --threads between runs.
Copy and paste the following loop directly into your terminal:
for threads in 1 2 4 8 16; do
    litespark-benchmark \
        --inference \
        --no-matrix \
        --threads "$threads" \
        --output "results-${threads}-threads.json"
done
Add higher thread counts such as 32 or 64 if your system has them available.
Prefill is compute-bound and generally continues to improve as you add threads. Token generation is more memory-bound and can flatten out earlier. The following chart illustrates this behavior on an Apple M5 Max.
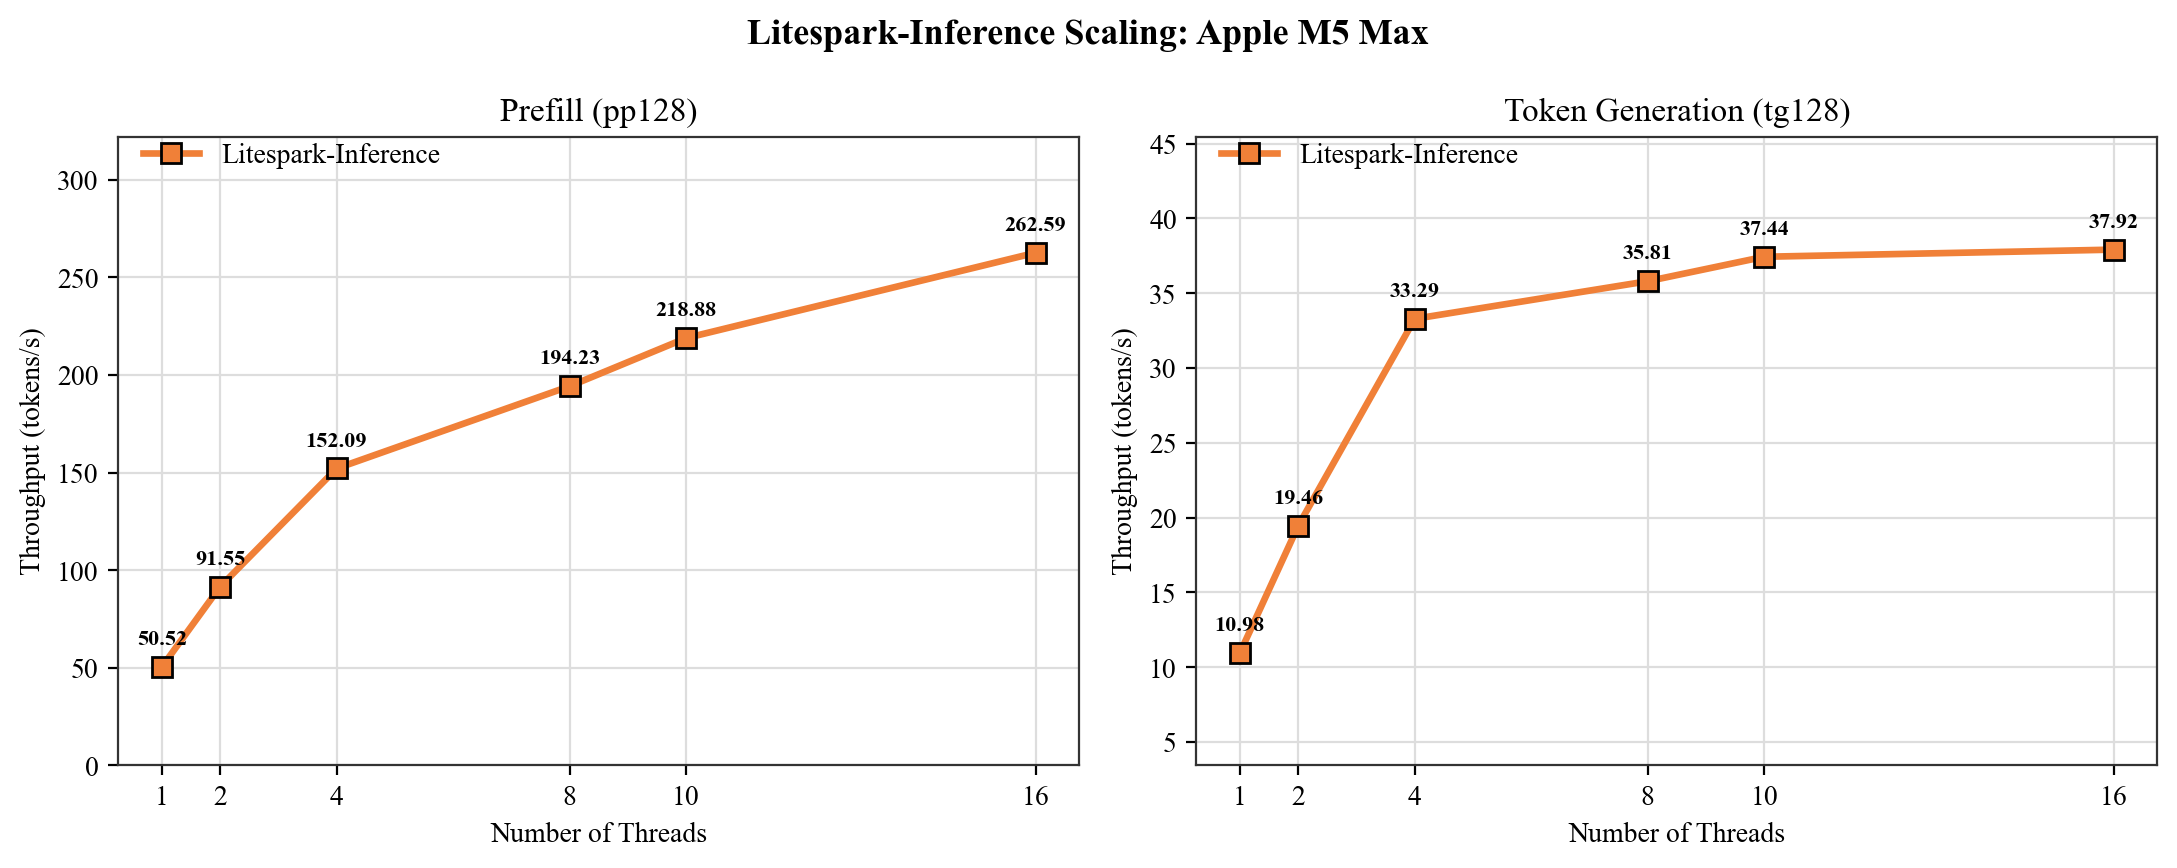 Thread scaling on Apple M5 Max
Measure energy use on macOS
The --power flag adds energy and joules-per-token measurements when the
platform exposes readable power counters. Energy measurement is available on
macOS through powermetrics. It isn’t available on Arm Linux because
Arm-based systems don’t expose powercap energy counters.
On macOS, refresh your sudo credentials so the benchmark can run
powermetrics, then start the measurement:
sudo -v
litespark-benchmark \
    --inference \
    --no-matrix \
    --threads "$(sysctl -n hw.logicalcpu)" \
    --power \
    --power-cooldown 10 \
    --output energy-macos.json
If the results report available: false, the platform doesn’t expose a
supported counter. The memory and throughput results remain valid.
Inspect the JSON results
The benchmark commands in the previous sections saved results to JSON files
using the --output flag. For example, the Arm Linux benchmark saved to
results-arm-linux.json and the comparison saved to comparison-arm-linux.json.
Format a saved JSON file with Python:
python -m json.tool results-arm-linux.json
Confirm that the system object reports aarch64 or arm64, and that
simd_features.neon is true. In benchmarks.inference, check the kernel and
thread count. The kernel should contain neon-torchless, and the thread count
should match the value passed with --threads.
What you’ve accomplished
You’ve now benchmarked Litespark-Inference on an Arm system with a controlled thread count. You’ve saved memory, TTFT, throughput, kernel, and system information as JSON, and measured how throughput changes with thread count. You’ve also identified when PyTorch and hardware energy counters are needed.
Use the saved JSON files to compare embedding data types or repeat the same workload on another Arm system.