Inspect model artifacts and runtime profiles with Google Model Explorer and Arm extensions
Introduction
Understand Model Explorer and the artifacts you will inspect
Install Model Explorer and the Arm extensions
Open and inspect a Cortex-M PTE with Model Explorer
Compare portable and XNNPACK PTE files with Model Explorer
Inspect Ethos-U PTE delegation with Model Explorer
Inspect TOSA artifacts with Model Explorer
Inspect VGF artifacts with Model Explorer
Inspect ETRecord and ETDump overlays with Model Explorer
Next Steps
Inspect model artifacts and runtime profiles with Google Model Explorer and Arm extensions
Introduction
Understand Model Explorer and the artifacts you will inspect
Install Model Explorer and the Arm extensions
Open and inspect a Cortex-M PTE with Model Explorer
Compare portable and XNNPACK PTE files with Model Explorer
Inspect Ethos-U PTE delegation with Model Explorer
Inspect TOSA artifacts with Model Explorer
Inspect VGF artifacts with Model Explorer
Inspect ETRecord and ETDump overlays with Model Explorer
Next Steps
View ExecuTorch runtime profiling data
PTE, TOSA, and VGF views help you learn what was exported, lowered, compiled, converted, or packaged.
Runtime profiling answers a different set of questions. With runtime profiling, you can learn what happened when the artifact ran on a specific runtime, runner, target hardware, and tracing configuration.
You’ll use the ExecuTorch extension for Model Explorer to view profiling data overlaid onto the model graph. To do this, the extension reads ETRecord and ETDump files. This closes the loop: you started from graph inspection and end by connecting that graph structure to measured runtime behavior.
ETRecord and ETDump
In ExecuTorch, ETRecord provides the export-time graph context. It preserves graph, operator, debug handle, and delegate partition metadata, allowing runtime measurements to map back to graph nodes.
ETDump contains runtime profiling data captured while the model executes with ExecuTorch event tracing enabled. The Model Explorer ETDump data provider presents aggregate timing measurements as overlays on graph nodes.
The two artifacts are most useful together:
| Artifact | Layer inspected | What it adds |
|---|---|---|
.etrecord | Export-time graph context | Graph structure, debug handles, operator names, and delegate partitions |
.etdp | Runtime profiling data | Aggregate node timing data from a specific execution |
.pte | ExecuTorch program | The packaged program and backend or delegate structure |
With the ETRecord loaded as graph context, the ETDump timing data becomes easier to interpret. Runtime measurements are linked to the corresponding nodes in the exported graph.
(Optional) Generate ETRecord and ETDump
Explore ETRecord and ETDump generation
ETRecord and ETDump are created at different points in the ExecuTorch workflow:
- Generate the ETRecord when you export or lower the model.
- Generate the ETDump when you run the exported
.pteprogram with event tracing enabled. - Analyze them together with the ExecuTorch Inspector, or load them together in Model Explorer with the combined ExecuTorch extension.
You’ll inspect the .etrecord and .etdp files provided in the repository. However, if you’re interested in learning how to generate your own, the following steps are a brief overview, including links to the relevant documentation. For more information, see the
Profile ExecuTorch models with SME2 on Arm
Learning Path.
The ExecuTorch ETRecord documentation describes ETRecord as an ahead-of-time debug artifact. It contains the Edge dialect graph, debug handles, and delegate debug maps that allow runtime data to be linked back to graph nodes and, when available, Python source information.
For guidance on preserving the original operators and representing delegated regions in Model Explorer, see Delegate visibility .
To generate an ETRecord, enable ETRecord generation during export or lowering, then retrieve it from the resulting program manager:
from executorch.exir.program import to_edge
from torch.export import export
exported_program = export(model, example_inputs)
edge_program = to_edge(
exported_program,
generate_etrecord=True,
)
# Apply backend partitioning or lowering here if your flow uses it.
executorch_program = edge_program.to_executorch()
with open("model.pte", "wb") as f:
f.write(executorch_program.buffer)
etrecord = executorch_program.get_etrecord()
etrecord.save("model.etrecord")
The ExecuTorch ETDump documentation describes ETDump as the runtime trace artifact. To produce it from a native runner, build ExecuTorch with developer tools and event tracing enabled:
cmake \
-DEXECUTORCH_BUILD_DEVTOOLS=ON \
-DEXECUTORCH_ENABLE_EVENT_TRACER=ON \
...
If you use a runner such as executor_runner, ETDump generation is usually exposed as a command-line option:
./executor_runner \
-model_path model.pte \
-etdump_path model.etdp \
-num_executions 1
If you’re integrating ETDump into your own C++ runner, create an ETDumpGen, pass it into runtime loading or the Module API, execute the model, then write the returned buffer to a file:
#include <cstdlib>
#include <fstream>
#include <memory>
#include <executorch/devtools/etdump/etdump_flatcc.h>
#include <executorch/extension/module/module.h>
using executorch::etdump::ETDumpGen;
using executorch::extension::Module;
Module module(
"model.pte",
Module::LoadMode::Mmap,
std::make_unique<ETDumpGen>());
// Execute the model, for example with module.forward(...).
if (auto* etdump = dynamic_cast<ETDumpGen*>(module.event_tracer())) {
const auto trace = etdump->get_etdump_data();
if (trace.buf && trace.size > 0) {
std::unique_ptr<void, decltype(&free)> guard(trace.buf, free);
std::ofstream file("model.etdp", std::ios::binary);
if (file) {
file.write(static_cast<const char*>(trace.buf), trace.size);
}
}
}
For Python runtime experiments, ExecuTorch can also emit ETDump when loading a program with enable_etdump=True:
from pathlib import Path
from executorch.runtime import Runtime
runtime = Runtime.get()
program = runtime.load_program(
Path("model.pte"),
enable_etdump=True,
debug_buffer_size=int(1e7),
)
forward = program.load_method("forward")
outputs = forward.execute(inputs)
program.write_etdump_result_to_file("model.etdp", "debug_output.bin")
After generating the files, you can check them using the ExecuTorch Inspector API :
from executorch.devtools import Inspector
inspector = Inspector(
etdump_path="model.etdp",
etrecord="model.etrecord",
)
inspector.print_data_tabular()
If you pass only an ETDump to the Inspector, you still get runtime events. If you also pass the matching ETRecord, the Inspector can correlate events with graph operators and delegate metadata.
Load profiling data
The combined ExecuTorch extension for Model Explorer contains an ETRecord adapter and an ETDump data provider. The ETRecord adapter opens the exported graph, and the ETDump data provider provides associated runtime timing data alongside it.
Open the .etrecord first, then add the matching .etdp profiling data. Keep the pairs together: an ETDump from one export can be misleading if it’s overlaid on a different ETRecord.
The workflow is:
Open the ETRecord
|
Inspect export-time graph context
|
Load the matching ETDump profiling data
|
Overlay runtime timing data
|
Connect graph structure to runtime cost
Inspect a portable kernel CPU profile
Start with a portable CPU run of OPT-125M by opening ml-model-artifacts/etrecord/opt125m_portable.etrecord and ml-model-artifacts/etdump/opt125m_portable.etdp.
Inspect the graph and profiling overlay, then look for the following:
- Any delegate partitions
- Whether most of the time is in native
OPERATOR_CALLevents - Repeated operators that dominate the profile
- How the runtime view compares with the portable
.pteview that you inspected
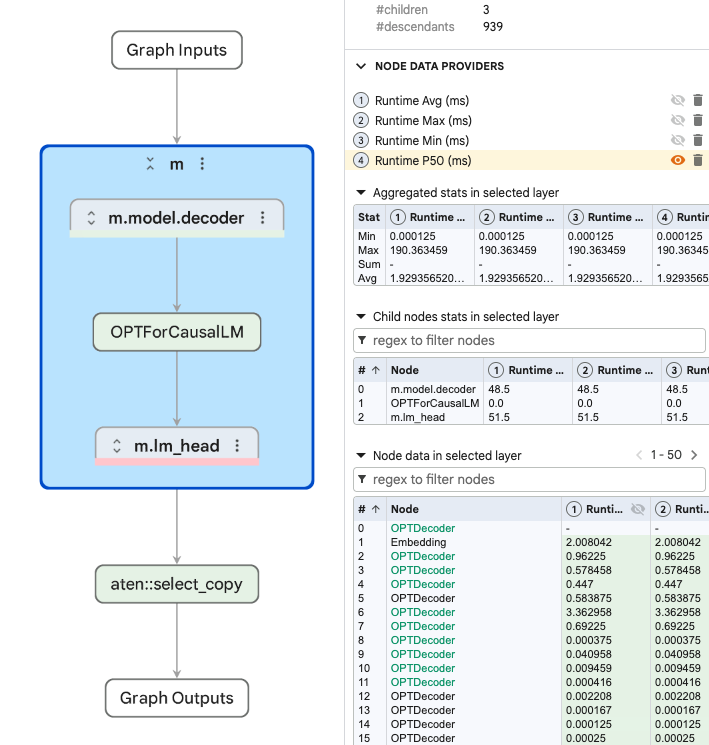
Portable OPT-125M runtime profile
This is a pure portable CPU run. The ETDump contains about 1,199 events, with Method::execute around 9,082 ms. There are no delegate calls. Almost all runtime is in native calls, with repeated aten.addmm events forming the main hotspot.
Use this profile as the baseline. The graph has no accelerated delegate region to inspect, so the overlay points directly at CPU operator execution.
Compare with XNNPACK delegation
Now open the XNNPACK version of the same model: ml-model-artifacts/etrecord/opt125m_xnnpack.etrecord and ml-model-artifacts/etdump/opt125m_xnnpack.etdp.
Compare it with the portable profile and look for the following:
XnnpackBackenddelegate events- How much of the total runtime is inside
DELEGATE_CALLevents - Native operators that still run outside the delegate
- How much faster this run is than the portable CPU baseline
XNNPACK delegate calls in the OPT-125M profile
The XNNPACK ETDump contains about 813 events, with Method::execute around 125 ms. The profile includes 98 delegate calls to XnnpackBackend. Delegate calls account for about 116.7 ms, while native calls account for about 8.5 ms.
This shows a clean CPU delegate acceleration pattern. The model still has some native work, but the expensive compute has moved into XNNPACK delegate calls. Compared with the portable run at about 9,082 ms, the runtime profile makes the acceleration effect visible.
Inspect the FP32 Ethos-U example
Next, inspect the MobileNetV2 FP32 example: ml-model-artifacts/etrecord/mobilenetv2_fp32_ethosu.etrecord and ml-model-artifacts/etdump/mobilenetv2_fp32_ethosu.etdp.
The example doesn’t produce an Ethos-U delegate region because Ethos-U requires supported quantized integer workloads.
Look for the following:
- No
EthosUBackenddelegate calls - Native
aten.convolution.defaultevents - A large
Method::executetotal - Runtime behavior that matches the FP32
.pteview from the Ethos-U section
FP32 MobileNetV2 profile without Ethos-U delegation
The ETDump contains about 309 events, with Method::execute around 395 million cycles. There are no delegate calls, and the native call sum accounts for almost all of the runtime. The profile is dominated by CPU-side convolution work.
Inspect clean Ethos-U delegation
Now open the regular INT8 MobileNetV2 Ethos-U profile: ml-model-artifacts/etrecord/mobilenetv2_int8_ethosu.etrecord and ml-model-artifacts/etdump/mobilenetv2_int8_ethosu.etdp.
Inspect the overlay and look for the following:
- Whether there’s one
EthosUBackenddelegate call - Work that remains outside the delegate
- Whether the largest runtime cost comes from the NPU event or from CPU-side quantization
- How this compares with the clean INT8
.pteview
Single Ethos-U partition with CPU-side quantization
This is the clean Ethos-U delegation case. The ETDump is small, with about 13 events. Method::execute is around 6.59 million cycles. There’s one EthosUBackend delegate call, and only a small number of native calls.
The important observation is that successful delegation doesn’t mean every runtime cost is inside the accelerator. In this profile, the visible DELEGATE_CALL is about 96.9 thousand cycles. The non-delegated quantize_per_tensor operation accounts for about 6.47 million cycles. The graph is cleanly delegated, but the measured runtime is dominated by non-delegated quantization rather than the delegate call itself.
Inspect fragmented Ethos-U delegation
Finally, inspect the fragmented INT8 MobileNetV2 profile: ml-model-artifacts/etrecord/mobilenetv2_lrn_int8_ethosu.etrecord and ml-model-artifacts/etdump/mobilenetv2_lrn_int8_ethosu.etdp.
Compare it with the clean INT8 profile and look for the following:
- Whether there are two
EthosUBackenddelegate calls instead of one - The native operators that appear between or around the delegate regions
- How large the non-delegated native cost is compared with the NPU cost
- Whether quantize and dequantize events appear around delegate boundaries
Fragmented Ethos-U profile with non-delegated work
Fragmentation can affect performance in different ways. Additional delegate boundaries can introduce data conversion, synchronization, or tensor movement. Non-delegated operators can also dominate runtime when their execution cost is much larger than the delegated work. Which effect matters most depends on the model, backend, and runtime.
In this trace, non-delegated work overwhelmingly dominates. The two EthosUBackend delegate calls account for about 105 thousand and 47 thousand cycles, while the overall Method::execute total is about 1.70 billion cycles. A large non-delegated aten.convolution.default island accounts for about 1.67 billion cycles. Quantize and dequantize operations add smaller costs around the delegate regions, including dequantize_per_channel at about 21.6 million cycles and quantize_per_tensor at about 6.47 million cycles.
This is the runtime version of the fragmentation pattern in the .pte and TOSA sections. In this example, the performance difference is driven primarily by the large non-delegated convolution island, not by the additional delegate boundary.
What you’ve learned
You’ve learned that ETRecord and ETDump add runtime context to static graphs. ETRecord gives you the graph and debug metadata, while ETDump contributes runtime timing data. Used together through the combined ExecuTorch extension, they show which parts of the graph cost time on the target.
The OPT-125M profiles made the CPU case clear: the portable run stayed on native operators, while the XNNPACK run moved most of the work into delegate calls. The MobileNetV2 profiles showed the same pattern for Ethos-U. Native CPU execution, clean Ethos-U delegation, and fragmented delegation are much easier to tell apart when the runtime data is overlaid on the exported graph.
You can now explore deeper workflows for generating, running, profiling, and optimizing your own models with Model Explorer.