Inspect model artifacts and runtime profiles with Google Model Explorer and Arm extensions
Introduction
Understand Model Explorer and the artifacts you will inspect
Install Model Explorer and the Arm extensions
Open and inspect a Cortex-M PTE with Model Explorer
Compare portable and XNNPACK PTE files with Model Explorer
Inspect Ethos-U PTE delegation with Model Explorer
Inspect TOSA artifacts with Model Explorer
Inspect VGF artifacts with Model Explorer
Inspect ETRecord and ETDump overlays with Model Explorer
Next Steps
Inspect model artifacts and runtime profiles with Google Model Explorer and Arm extensions
Introduction
Understand Model Explorer and the artifacts you will inspect
Install Model Explorer and the Arm extensions
Open and inspect a Cortex-M PTE with Model Explorer
Compare portable and XNNPACK PTE files with Model Explorer
Inspect Ethos-U PTE delegation with Model Explorer
Inspect TOSA artifacts with Model Explorer
Inspect VGF artifacts with Model Explorer
Inspect ETRecord and ETDump overlays with Model Explorer
Next Steps
Launch Model Explorer
Launch Model Explorer with all the extensions that you’ll use. The combined ExecuTorch extension opens .pte and .etrecord files and adds .etdp profiling data. The separate TOSA and VGF extensions open .tosa and .vgf files.
Launching Model Explorer opens a webpage in your browser.
python -m model_explorer --extensions=executorch_extension_model_explorer,tosa_adapter_model_explorer,vgf_adapter_model_explorer
python -m model_explorer --extensions=executorch_extension_model_explorer
python -m model_explorer
Press Ctrl+C to stop Model Explorer.
If you’re interested in a specific model format or a particular target, skip to the appropriate section.
Inspect the Cortex-M PTE
You’ll start with a .pte generated for the Cortex-M backend. This .pte was generated for the MobileNetV2 model, a typical Convolutional Neural Network (CNN) used in embedded ML.
The ExecuTorch Cortex-M backend prepares models for Arm Cortex-M microcontrollers, where memory and compute resources are much more limited than on application-class CPUs. The backend rewrites supported quantized operators so they can use CMSIS-NN, an Arm library of optimized neural network kernels for Cortex-M processors.
CMSIS-NN exists to make common ML operations such as convolutions, fully connected layers, activations, and quantization-related operations run efficiently on small embedded CPUs. Use this first .pte to learn the Model Explorer interface while seeing how an ExecuTorch graph can reflect Cortex-M-specific lowering.
The Cortex-M backend is a work-in-progress proof of concept. It’s not intended for production use, and APIs might change without notice. However, the .pte is pre-generated for you in the provided repository. To learn more about the Cortex-M backend, see the
Cortex-M Backend Documentation
, which also links to a Jupyter Notebook.
To inspect the Cortex-M PTE, follow these steps:
- In Model Explorer, open
ml-model-artifacts/pte/mv2_cortex_m.pte.
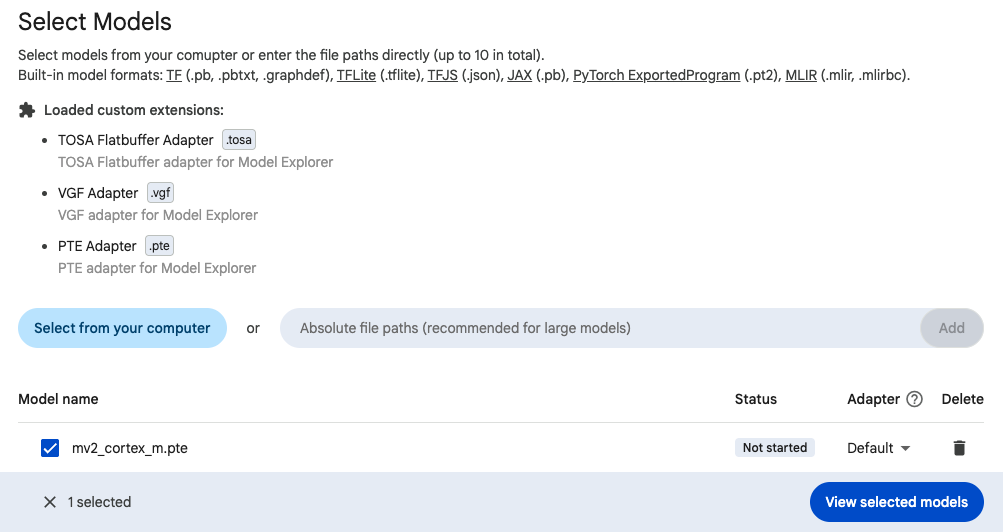 Model Explorer with the Arm adapters and Cortex-M PTE selected
- Select View selected models.
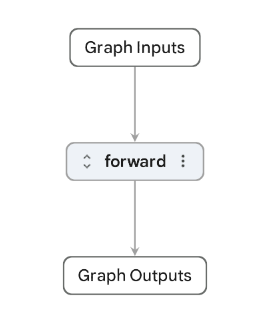 Top-level Cortex-M PTE graph
The graph information panel shows the op node count and layer count. The op node count is the number of operator nodes in the graph. The layer count is the number of hierarchical graph components represented in the current view, not necessarily the number of neural network layers in the original model.
- Expand the
forwardlayer to view its operators. Select an operator, such ascortex_m::quantize_per_tensor, to see its attributes, inputs, and outputs in the node information panel.
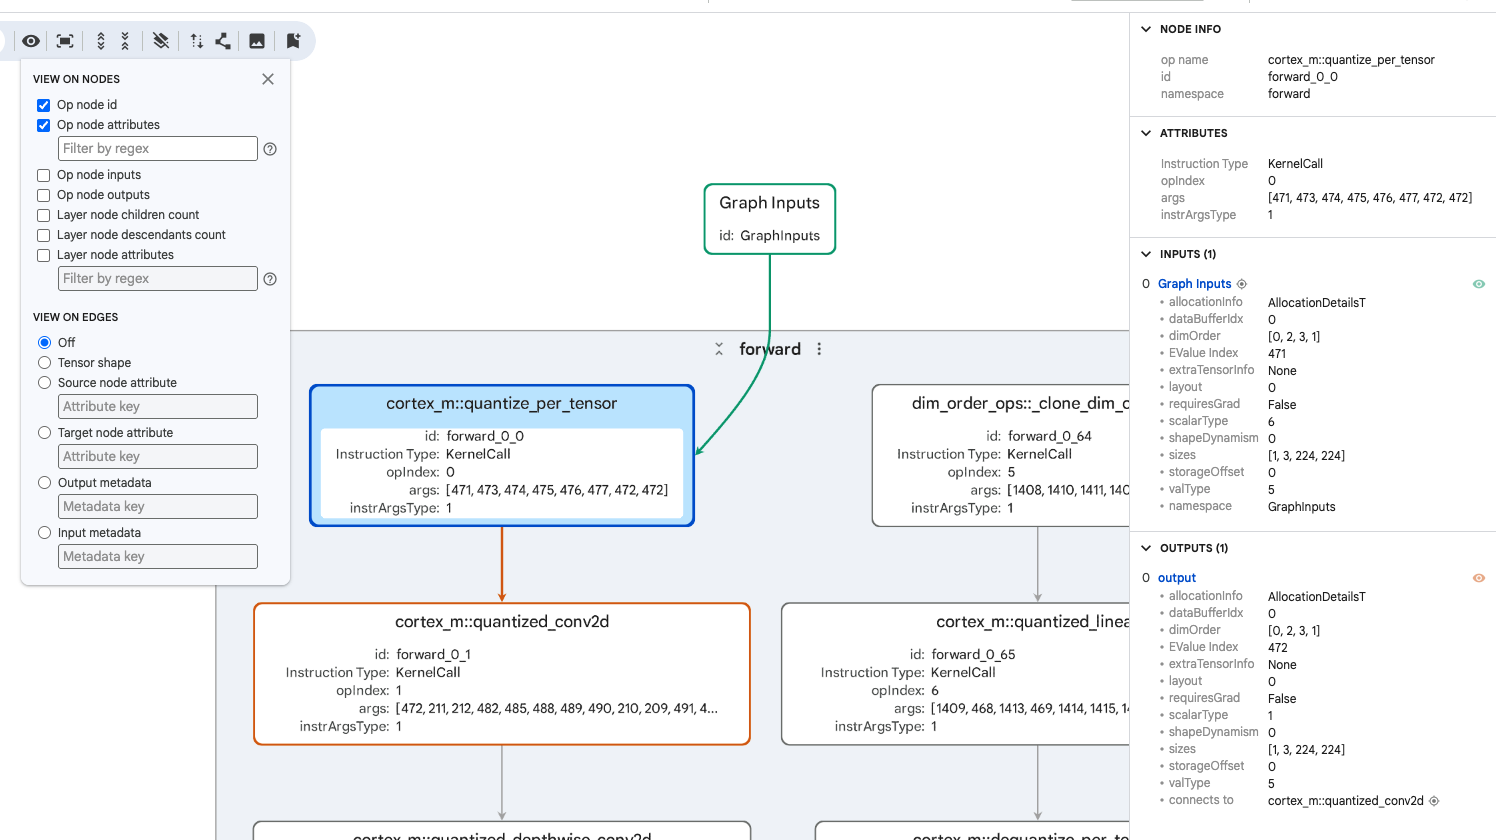 Cortex-M operator metadata in Model Explorer
When you inspect a .pte for the first time, focus on the higher-level graph information first:
- Operator names show the work the ExecuTorch program will perform.
- Inputs and outputs show how tensors flow through the graph.
- Tensor shapes and types help you check whether the model was exported and quantized as expected.
- Hierarchical layers let you expand or collapse parts of the graph so you can move between an overview and individual operators.
- Delegate or backend-specific names show where a backend flow has changed the graph. In this Cortex-M example, names such as
cortex_m::...indicate operators affected by the Cortex-M backend flow.
You might also see lower-level .pte execution fields in the node attributes. These fields come from the serialized ExecuTorch program:
| Field | What it means |
|---|---|
instruction type: KernelCall | The instruction calls an ExecuTorch operator kernel. A kernel is the code that executes a model operator for a runtime or backend. |
instr_args_type: 1 | The internal FlatBuffer type tag for the instruction arguments. In this case, 1 identifies the arguments as a KernelCall. |
op_index | An index into the .pte operator table. It tells ExecuTorch which operator this instruction calls. |
args: [471, 473, 474, ...] | Indexes into the .pte values table. These entries identify the tensors or other values used as inputs and outputs by the instruction. |
You don’t need to memorize these internal fields. Use the fields as clues when you want to connect a visible graph node to the underlying ExecuTorch program structure.
- Select the eye icon in the toolbar to open the View on nodes panel.
- Select the data you want to display, such as Op node id and Op node attributes, to show more information in the graph.
What you’ve accomplished and what’s next
You’ve launched Model Explorer with the Arm extensions and confirmed the installation by opening your first .pte artifact. You’ve also learned how to inspect the graph overview, expand into the forward layer, read operator metadata, and interpret common low-level .pte fields such as KernelCall, op_index, and args.
Next, you’ll keep the same browser tab open and compare portable and XNNPACK .pte artifacts to see how backend delegation changes the graph.