Debug Arm Zena CSS Reference Software Stack with Arm Development Studio
Introduction
Getting started
Launch the FVP
Configure the model
Create debug connections
Debug RSE from reset
Debug Safety Island code
Debug primary compute and Linux
Next Steps
Debug Arm Zena CSS Reference Software Stack with Arm Development Studio
Overview
You’ll now move on to debug the initial code that runs on the Runtime Security Engine (RSE) based on Cortex-M55 in the Zena CSS FVP. You will launch the model with the Iris debug server, connect from Arm Development Studio, load Trusted Firmware-M (TF‑M) symbols, and step from reset.
Launch the FVP and hold at reset
Start a new tmux session for the FVP if needed:
tmux new-session -s arm-auto-solutions
Navigate to your code repository, then launch the FVP with Iris without running so it stays at reset:
kas shell -c "../layers/meta-arm/scripts/runfvp -t tmux --verbose -- --iris-server --iris-port 7100"
The FVP initializes and prints information messages, for example:
        ...
Info: RD_Aspen: RD_Aspen.css.smb.rse_flashloader: FlashLoader: Saved 64MB to file '~/arm-auto-solutions/build/tmp_baremetal/deploy/images/fvp-rd-aspen/rse-flash-image.img'
Info: RD_Aspen: RD_Aspen.ros.flash_loader: FlashLoader: Saved 128MB to file '~/arm-auto-solutions/build/tmp_baremetal/deploy/images/fvp-rd-aspen/ap-flash-image.img'
Note that execution has not started.
If you need remote debugging, start the FVP with -A and ensure the chosen Iris port (default 7100) is reachable through your firewall.
Connect the debugger to RSE (Cortex-M55)
Use the RSE model connection you created earlier to attach the debugger. The processor is stopped before the first instruction.
The FVP configures the secure vector table (VTOR_S) at 0x11000000. If you inspect memory at that address, the vector table is populated, but source is not visible until you load symbols.
Load TF‑M symbols and map sources:
- In Debug Control, open the pane menu and choose Load…
- Select Add Symbols file.
- Locate the TF‑M image, for example:
/arm-auto-solutions/build/tmp_baremetal/work/fvp_rd_aspen-poky-linux/trusted-firmware-m/2.2.1+git/build/bin/bl1_1.axf
When prompted for substitute path, map build-time paths to your local sources, for example:
/usr/src/debug/trusted-firmware-m/2.2.1+git/
/arm-auto-solutions/build/tmp_baremetal/work/fvp_rd_aspen-poky-linux/trusted-firmware-m/2.2.1+git/git/tfm/
Step one instruction to fetch the reset handler and stop there. In the debugger Commands pane enter:
stepi
You can now step through code, set breakpoints, and inspect the target as the code proceeds.
Paths vary by environment. Use your actual build output and source locations when adding symbols or configuring path substitution.
Automate setup with debugger commands
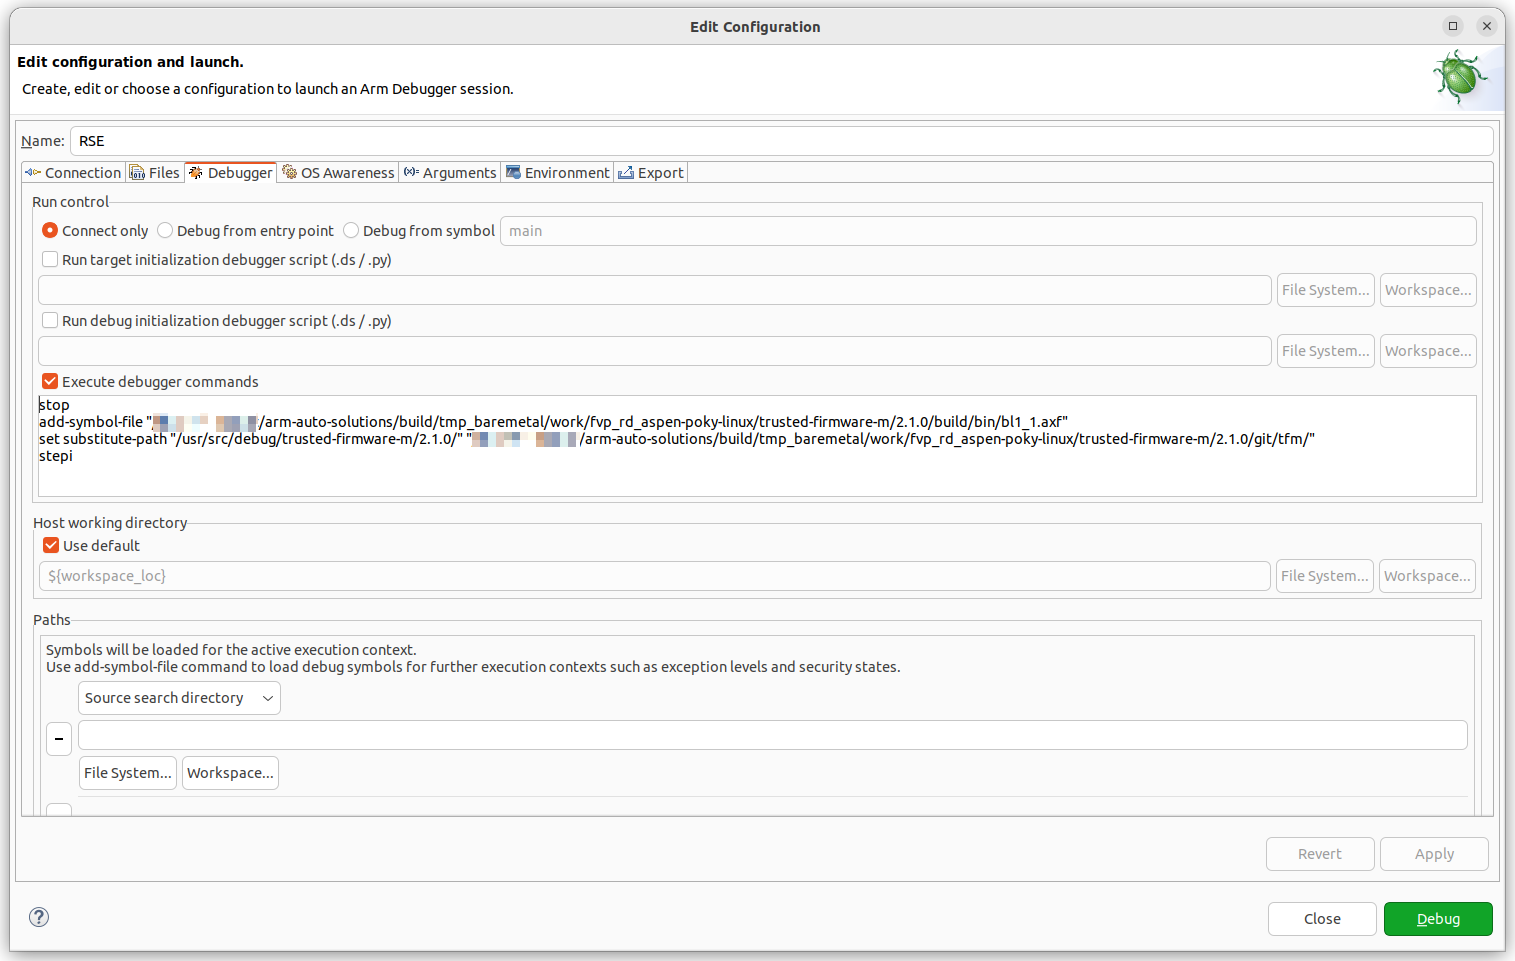
Automate the connection steps by adding Debugger Commands to the .launch configuration so they run on every attach:
- Open (double-click) your RSE.launch file.
- Go to the Debugger tab.
- Enable Execute debugger commands.
- Add commands similar to the following (adjust paths as needed).
stop
add-symbol-file "/arm-auto-solutions/build/tmp_baremetal/work/fvp_rd_aspen-poky-linux/trusted-firmware-m/2.2.1+git/build/bin/bl1_1.axf"
set substitute-path "/usr/src/debug/trusted-firmware-m/2.2.1+git/" "/arm-auto-solutions/build/tmp_baremetal/work/fvp_rd_aspen-poky-linux/trusted-firmware-m/2.2.1+git/git/tfm/"
stepi
Use the Commands or History pane to see and copy the equivalent debugger commands of the GUI actions.
 RSE Debugger pane with TF-M symbol loading and source path substitution