Visual Studio Extension for WindowsPerf
About this Install Guide
| Reading time: | 10 min |
| Last updated: | 22 Jun 2026 |
| Reading time: |
| 10 min |
| Last updated: |
| 22 Jun 2026 |
This guide shows you how to install and use the tool with the most common configuration. For advanced options and complete reference information, see the official documentation. Some install guides also include optional next steps to help you explore related workflows or integrations.
WindowsPerf is a lightweight performance profiling tool inspired by Linux Perf, and designed specifically for Windows on Arm.
The WindowsPerf GUI is a Visual Studio 2022 extension that provides an intuitive, integrated experience within the Visual Studio Integrated Development Environment (IDE). The extension allows developers to interact with WindowsPerf, adjust settings, and visualize performance data seamlessly in Visual Studio.
Before you begin
Before installing the Visual Studio Extension for WindowsPerf, complete the following steps:
- Install Visual Studio 2022 on your Windows on Arm device.
- Install WindowsPerf using the WindowsPerf install guide .
- Install the LLVM toolchain using the LLVM toolchain for Windows on Arm install guide .
The disassembly feature requires llvm-objdump in the search path. Verify that your %PATH% variable includes the location of llvm-objdump to ensure proper functionality.
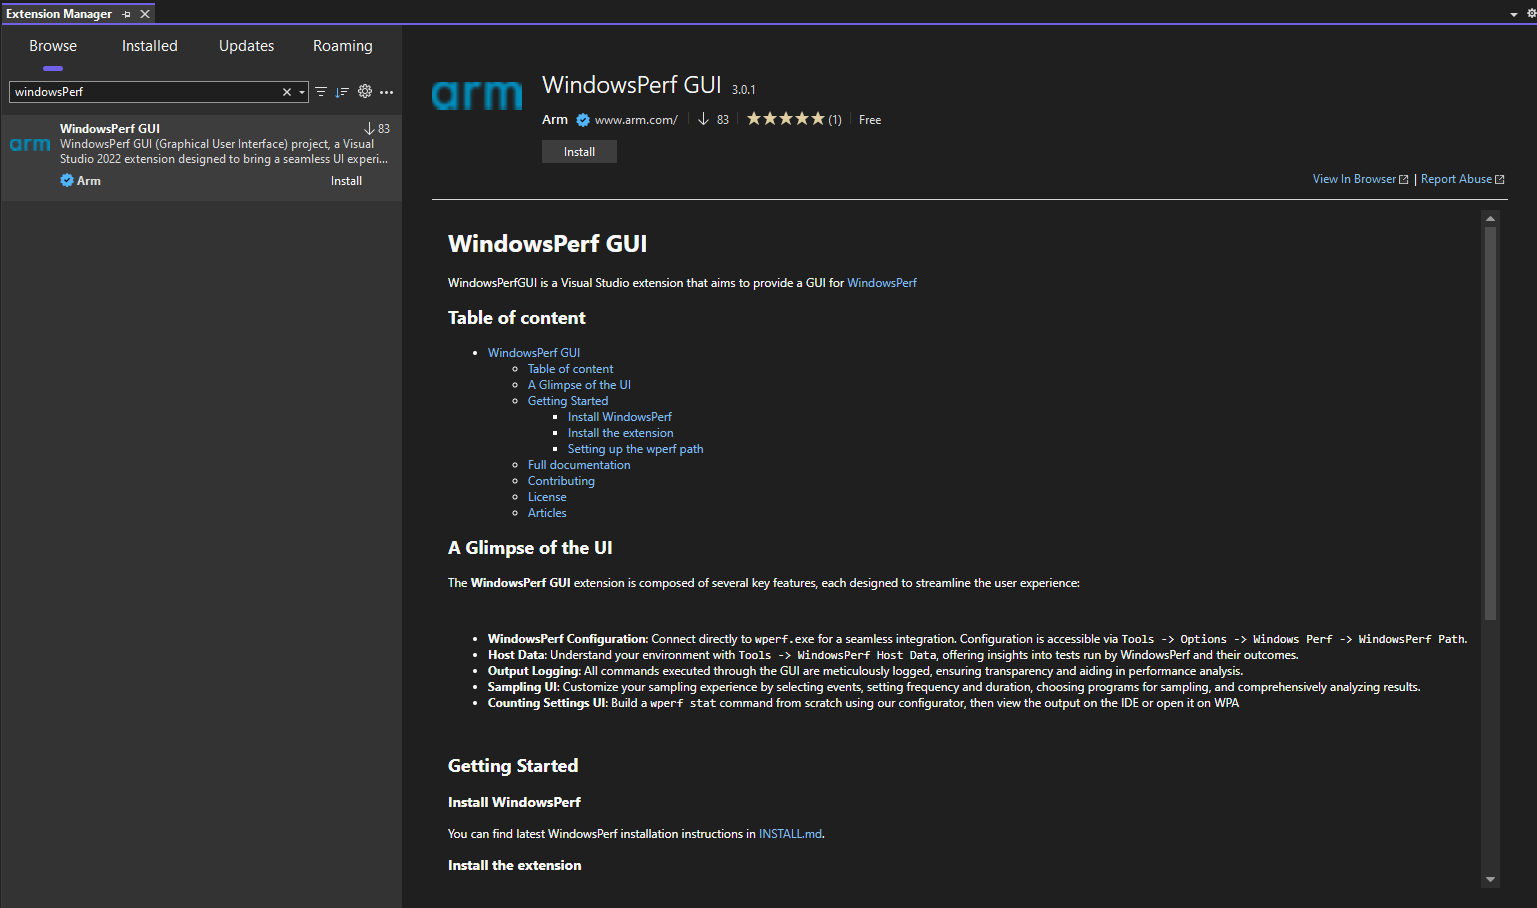
Install the extension using the Visual Studio Extension Manager
To install the Visual Studio extension for WindowsPerf from Visual Studio, use the Extension Manager:
- Open Visual Studio 2022.
- Navigate to the
Extensionsmenu, and selectManage Extensions. - Select the
Search (Ctrl+L)bar, and typeWindowsPerf. - Select the
Installbutton. - Restart Visual Studio to complete installation.
Install the extension from GitLab
You can also install the WindowsPerf Visual Studio Extension from GitLab.
Using a browser, visit the
Releases
page and download the latest file. For example, windowsperf-gui-5.4.0.zip.
Unzip the downloaded file and double-click on the WindowsPerfGUI.vsix file.
Follow the prompts to install the Visual Studio extension.
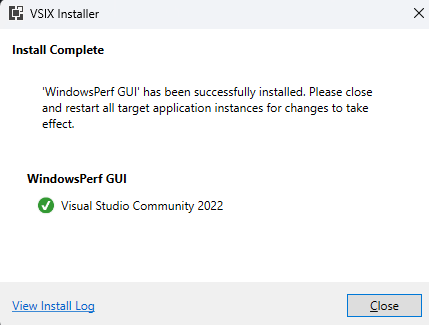
Ensure that any previous version of the extension is uninstalled and that Visual Studio is closed before installing the extension.
Build and install the extension from source code
You don’t need to build the source, but it is an alternative installation method if you want to customize the extension.
To build the source code, clone the repository using Git:
git clone https://gitlab.com/Linaro/WindowsPerf/vs-extension.git
Double-click the WindowsPerfGUI.sln solution file to open the project Visual Studio.
Visual Studio might prompt you to install additional components required to build the project. Install these components.
Open the Build menu and select Build Solution to create WindowsPerfGUI.dll and WindowsPerfGUI.vsix. You can replace the currently installed files with these files to try any changes you’ve made.
Set up WindowsPerf in Visual Studio
After installing the extension, you need to link the extension with the wperf.exe file by navigating to Tools > Options > WindowsPerf > WindowsPerf Path in Visual Studio.
Use the Select button to navigate to your wperf.exe and the Validate button to confirm the executable is found.
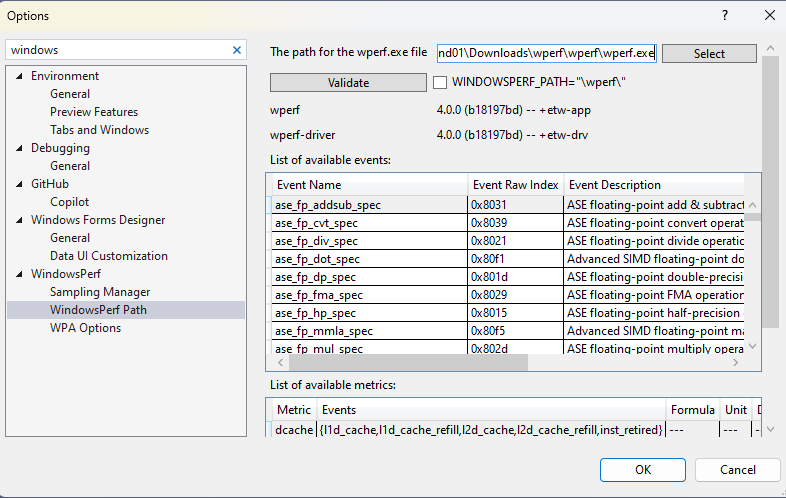
This step is crucial for utilizing the extension. The extension will not work without this configuration.
Key features of the WindowsPerf extension
The WindowsPerf extension is composed of several key features, each designed to streamline the user experience:
- WindowsPerf Configuration: Connect directly to
wperf.exefor a seamless integration. - Host Data: Understand your environment by selecting
ToolsthenWindowsPerf Host Data. - Output Logging: All commands executed through the GUI are logged, ensuring transparency and aiding with performance analysis.
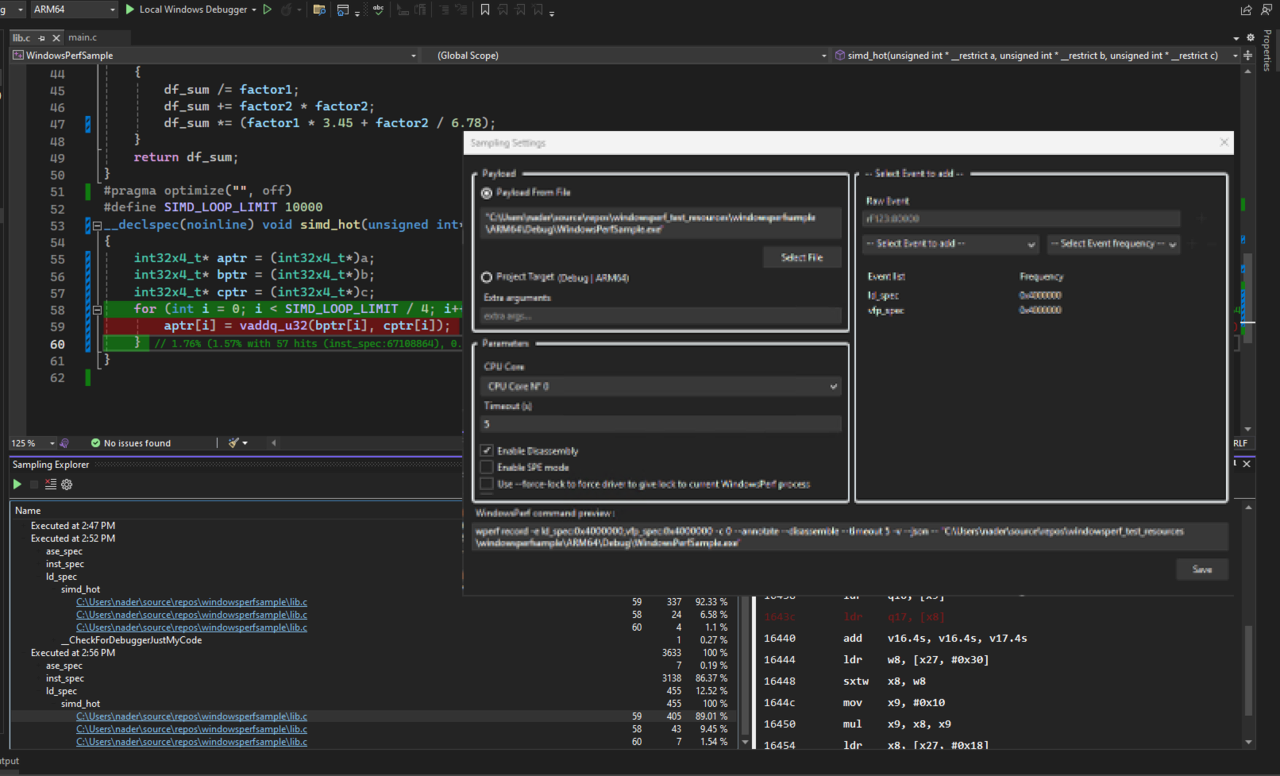
- Sampling UI: Customize your sampling experience by selecting events, setting frequency and duration, choosing programs for sampling, and comprehensively analyzing results.
The sampling interface is shown as follows:
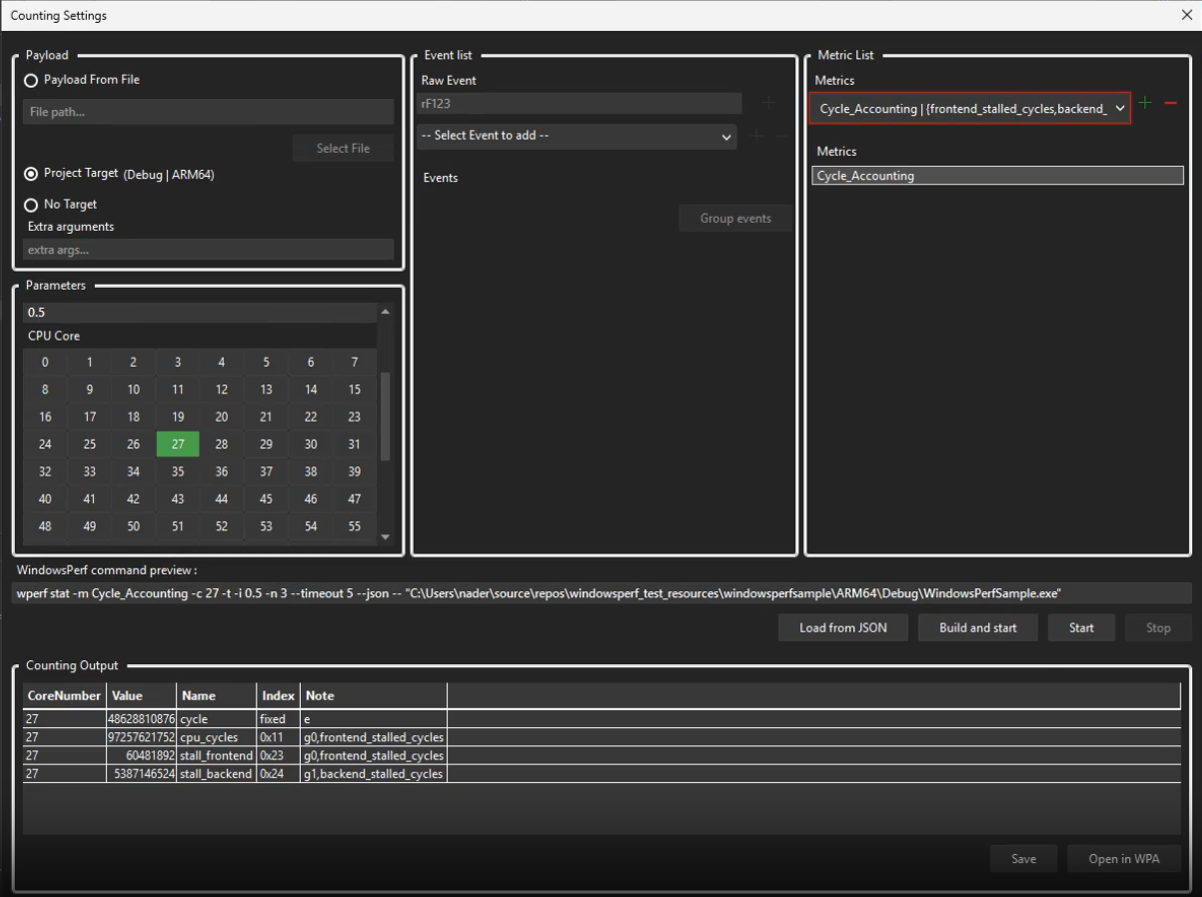
- Counting Settings UI: Build a
wperf statcommand from scratch using the configuration interface, then view the output in VS Code or open it with Windows Performance Analyzer (WPA). The interface to configure counting is shown as follows:
You’re now ready to use the WindowsPerf extension on VSCode.
Uninstall the WindowsPerf extension
To uninstall the extension in Visual Studio:
Go to Extensions > Manage Extensions > Installed > All > WindowsPerfGUI and select Uninstall.
Visual Studio will schedule the uninstallation. To complete the process, close Visual Studio and follow the uninstall dialog prompts.
Give Feedback
How would you rate this tool quick-install guide?
What is the primary reason for your feedback ?
Thank you! We're grateful for your feedback.
- Have more feedback? Log an issue on GitHub.
- Want to collaborate? Join our Discord server.